
By Dr Paul Cuddon
Healthcare and Life Sciences

and Dr Clare Craig
Diagnostic Pathologist

Are early warning signs from the UK’s ONS Infection Survey a missed opportunity in predicting outbreaks?
Mass testing of a healthy population is another intervention explicitly not recommended in any pandemic planning for respiratory viral pathogens before 2020. HART’s view is that a high degree of assurance that such a measure will be net-beneficial should be required before it is embarked upon and that this should be reviewed constantly.
Whatever the merits of performing such testing in 2020 in “the eye of the storm” (and even that is not agreed by all), HART’s view is that mass testing of asymptomatic individuals is no longer delivering any benefits at all and is actually causing substantial societal harms. However, to the extent that any testing (e.g. for prevalence purposes) might be justified, it is surely incumbent upon the Government to maximise the utility of any data thereby obtained, and in this regard HART believes the Government has failed.
We have grave concerns that the ONS modelling used to drive policy decisions was fundamentally flawed. There is a pattern whereby raw data was modelled up before lockdowns and modelled down after lockdowns. Their own modelled figures have been retrospectively altered on many occasions, regionally and nationally. Even their data in one week can be contradictory, e.g. the data is falling in each age group but apparently rising overall (e.g. week ending 8 January, 2021).
Ability to predict outbreaks
One of the main uncertainties throughout the pandemic is where SARS-CoV-2 will strike next. We seem to be taken by surprise time and time again with alarms sounding only when ICUs are already overrun, despite billions invested in NHS Test and Trace, as well as copious and regular data made available from warning systems from lower cost symptom trackers (ZOE), and NHS 111/999 triage.
We propose a simple model, which emphasises infectiousness, and enables the ONS data to be used as an effective early warning system giving a three-week warning prior to rising hospital admissions.
Shortcomings of the ONS Infection Survey
The ONS Infection Survey was one of the most innovative means to identify regional outbreaks, but it has also been one of the most disappointing. It was intended to randomly screen a regular sample of the population across the entire UK to identify regional outbreaks early and prepare local health systems for the pressures they may be about to face.1
The ONS system has been failing to detect local outbreaks in good time ahead of hospitalisations, because of the significant time taken to model the data and because infectiousness as a key indicator for an “epidemiological early warning system” is being ignored. In our view, the interpretation of the survey failed the NHS ahead of both the autumn and winter surges, with the timing of alerts coinciding with already increasing hospital admissions. For instance, as of early to mid-September there were few warning signs of then imminent pressure on the NHS in the North West and North East, and as of Christmas Eve, no signs of the pressure in London, the East of England, or in the South East over Christmas and New Year.
The time lag issue
SAGE relies heavily on modelling to predict the course of the pandemic. The ONS Infection Survey is no different. The survey’s results have been used as the main justification for the second and third national lockdowns.2 Each week the survey reports the ‘raw positivity’ i.e. the number of positive tests as a proportion of the total number of tests performed. However, the ONS then spends several days analysing the data and only publishes the “modelled estimate of positivity” 6 days after the end of the week of testing. The time lag between samples being taken, tested and analysed is unknown, but given the reliance on the postal system to send and return tests there could be a significant delay between sampling and reporting.
There has long been a debate over the usefulness of PCR testing to detect infectious patients. The debate centres on the viral load in patients and related ability to transmit virus. The level of viral load detected by PCR testing correlates to the number of PCR cycles required to reach a positive result (each cycle represents a doubling of viral material). This is known as the cycle threshold (Ct). The lower the Ct threshold required to reach a positive result, the higher the viral load detected. The ONS has itself shown, in its household transmissions studies, that results with Ct above 25 are unlikely to represent any infectiousness.3 This tallies with prior reports which found that it was challenging to culture live virus above Ct 24.4 On the ONS Infection Survey around 80% of current positives are Ct above 25, and so the prevalence of infectious subjects is being overstated 4-fold.5
Solution
In practice there is a very simple way to improve the ability of the ONS Infection Survey to serve as an early-warning system, by shifting focus to infectious cases. The ONS itself proposed such a system in October.6 We would urge far greater focus on the number of PCR cycles (each a doubling of viral material) required to reach a positive result.
The good news is that since the New Year the ONS Infection Survey has included regional Ct values in each week’s update. This allows the use of a simple Ct model to predict outbreaks which would not rely on the analysis and modelling of the raw data now employed and so would reduce the time-lag that entails. Given the outbreaks in Spring 2020 there is an argument for caution as we head into Spring 2021. We would urge increasing vigilance on regional average Ct values from the ONS Infection Survey.
It should be noted that false positives can be reduced by testing for more genes. However, the ONS results indicate that they consider single gene positives as if they were definite positives7 even though this is deviating from WHO recommendations to follow the manufacturer’s instructions. The ONS itself has said that single gene positives in people without symptoms almost invariably are weak PCR positives with Ct values above 30, levels at which it is incredibly hard to culture viable, infectious viral particles. Put another way, these are most likely false positives and moving forward, these should not be included in the data set.
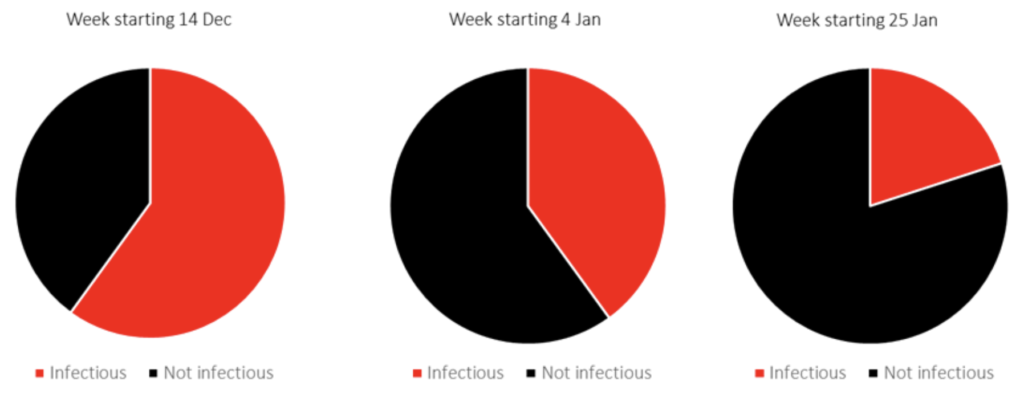
Monitoring community infectiousness in London
When we apply the infectiousness threshold (Ct less than 25) to the ONS Ct data for London, we note that around two thirds of positives were “infectious” on week starting 14 December, falling to 40% by the time the third national lockdown was announced and declining to less than 25% from week starting 25 January.
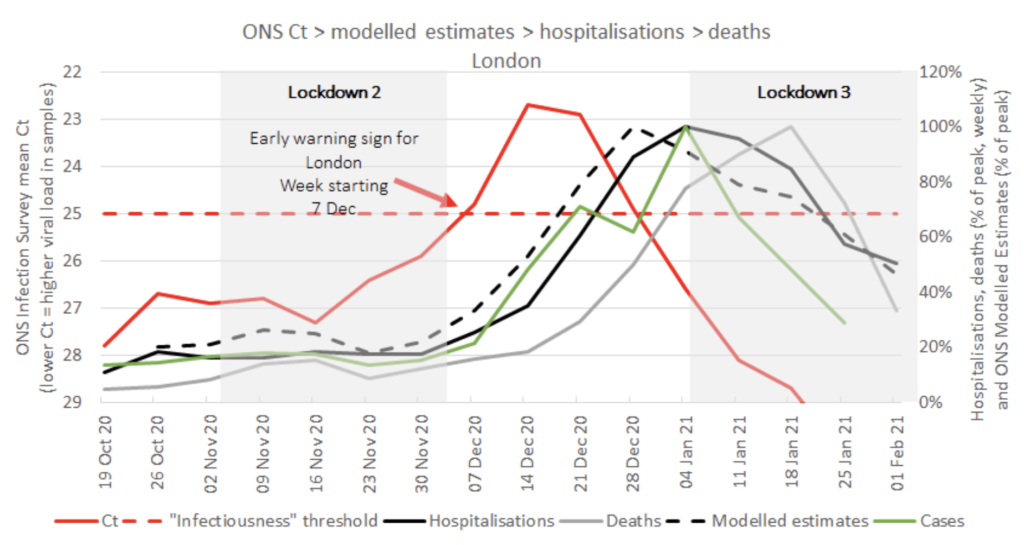
Practical application of mean Ct values in London
Here we show a time course of the mean Ct value for ONS positives in London (red) peaks weeks before cases (green), hospitalisations (black), ONS Modelled Estimates of Positivity (dashed) and deaths (grey). The average ONS positive falls below the ONS Infectiousness threshold (red dashed line) from week starting 7 December and peaks weeks ahead of all other data used on the Government’s coronavirus dashboard. We propose this is the time the NHS should have been warned of imminent pressure in specific regions.
What else can be addressed using longitudinal Ct values by region?
We also believe the Ct data in the ONS Infection survey can help address several important issues:
- We can investigate the effectiveness of various non-pharmaceutical interventions using Ct/infectious patients since Ct is independent of case numbers and changes in testing volumes;
- Ct can help advance the discussion on how PCR screening and lateral flow tests can be used most effectively together in a cost-effective, targeted manner;
- ONS Ct may be the more objective, data-backed basis for regional “alert” levels rather than “R” calculations that are incredibly wide and often too late to inform responses.
Endnotes
1. COVID Infection Survey
2. Geographical spread of COVID-19 in England
3. Coronavirus (COVID-19) Infection Survey: cycle threshold and household transmission analysis
4. Predicting Infectious Severe Acute Respiratory Syndrome Coronavirus 2 From Diagnostic Samples
5. Coronavirus (COVID-19) Infection Survey, UK: 19 February 2021
6. Viral load in community SARS-CoV-2 cases varies widely and temporally
7. Positive results from UK single gene testing for SARS-COV-2 may be inconclusive, negative or
detecting past infections
