

The country most often cited as proof that mandatory folic acid fortification works quietly stopped collecting the data needed to prove it.
Dr Clare Craig
Australia is held up around the world as the country that proved mandatory folic acid fortification works. From September 2009 folic acid was added to almost all bread-making flour, and a later review reported a 14.4 per cent fall in neural tube defects. The figure is quoted in support of the same policy now arriving in the United Kingdom. There is one problem. The data that could have tested the claim stopped being published.
Fifteen years on:
• Australia no longer publishes national neural tube defect prevalence counting terminations, which is the measure a fair evaluation needs.
• The only national analysis that did covered just eighteen months after fortification.
• Every later economic analysis reuses that same short dataset.
• The replacement surveillance system counts babies born, not affected pregnancies.
The silence is telling. When the first post-fortification data was collected, the AIHW announced them with confidence and in 2018 the policy was named one of the country’s top public health successes of the past two decades based on an analysis that stopped abruptly in 2011. Then the announcements stopped. A genuine success accumulates evidence: each fresh year of data restates the claim and strengthens it, and those responsible have every reason to keep publishing it. Instead, the result was proclaimed once, early on, but data that would have confirmed or corrected it was discontinued. Why?
Australia knew exactly how to measure it
In 2011, two years after the fortification mandate, the Australian Institute of Health and Welfare published a baseline report, expressly so that the effect of fortification could be judged afterwards. It set out how the measurement had to be done. Because most affected pregnancies are diagnosed early and end in termination, a true prevalence figure has to count terminations as well as births. It named the three states with near complete ascertainment, Victoria, South Australia and Western Australia, as the sound basis for any measurement. It even recommended correcting for the year on year decline observed in recent decades. The methods were clear but the results never came in.
The definitive post-policy analysis, Hilder‘s report on 2007 to 2011, is the last national analysis that counted terminations. After it there was:
• no national prevalence counting terminations;
• no longer follow-up period, the window closing at conceptions in March 2011;
• no independent confirmation;
• only repeated reuse of that same eighteen-month dataset, including in the economic evaluation published in 2019.
Australia changed what it counted
Data that has been published in a national collection is not capable of answering the question. After a gap back to 2008, the AIHW published congenital anomalies reports for babies born in 2016 and 2017. On the surface the series had resumed. In practice it had been rebuilt to count a different thing:
• It excludes terminations before twenty weeks. Between roughly three-quarters and four-fifths of neural tube defect pregnancies end in early termination or fetal death, so a collection that starts counting at twenty weeks captures only a fraction of the cases. The report says its own figures underestimate prevalence.
• Western Australia, the register the baseline singled out as most trustworthy, supplied no data for 2017 at all.
• Its authors describe their data as not directly comparable with the earlier reports. Why not publish parallel data that would be?
The data collected and published is designed to undercount the total.
Every route to the answer is closed off
The point is not that Australia lacks health data. It is that every system able to measure this has either stopped reporting it or measures something adjacent:
• Total prevalence counting terminations ends with conceptions in March 2011, in Hilder‘s report. No national data with this method has been published since.
• Western Australia has counted developmental anomalies under statutory notification since 2011, and South Australia counts terminations at any gestation, yet neither has published a continuing prevalence series past the early 2010s. Why not?
• The revived national collection counts terminations only after twenty weeks gestation and omits Western Australia. They even state that their figures underestimate prevalence and are not comparable with the earlier series.
• Data recording termination-for-anomaly is mandated in several states but no longer published as a defect-specific series.
• Hospital procedure counts run to 2023 to 2024, but a change in practice to repair spina bifida in utero means the numbers are not a continuous series. The terminated majority are also omitted from this measure.
• A fraction could be recorded in mortality records which run to 2020 but these miss terminations and are confounded by improving survival.
Every route fails to answer the question.
A 14.4 percent reduction still sounds worthwhile though?
The downward trend in cases begins years before fortification. The only post-fortification data point lies close to where that trend was already heading, especially once year to year variation is considered.
1. The decline began before fortification. The baseline found prevalence falling on a fitted trend of 0.23 per 10,000 births each year from 1998, before any mandate.
2. The government’s own modelling admits much of the fall was already happening. If the existing trend is extrapolated the post-mandate rate of 8.7 in 2010 would be seen by about 2014.
3. However, the year to year variation is wide. The 14.4 per cent barely reaches significance. So the headline only counts as significant because the weakest, New South Wales data, which under-counts terminations, is left in. Take it out and the fall shrinks to 12.5 per cent and is no longer significant.
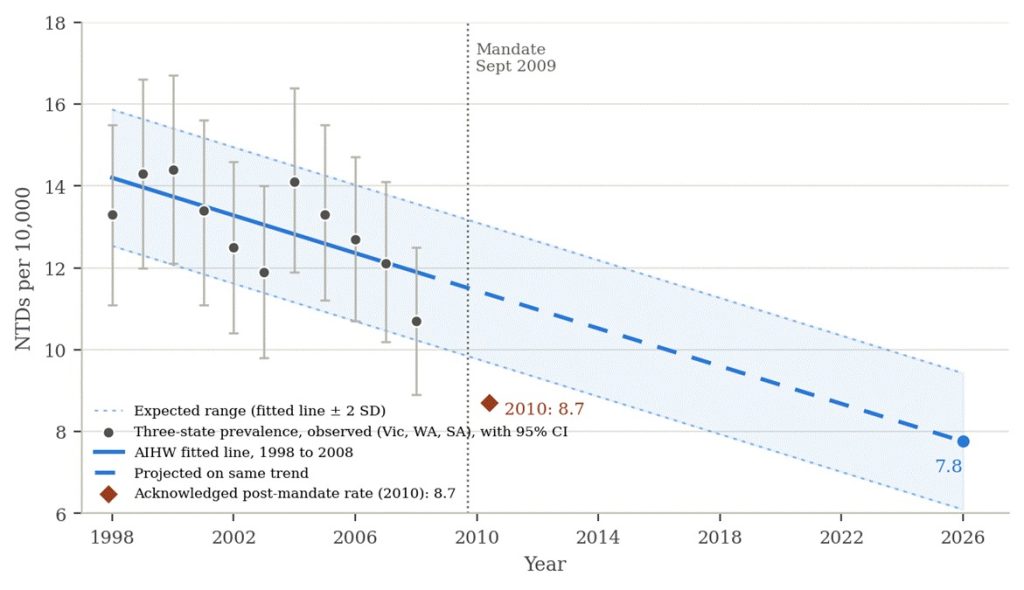
Figure 1. Three-state total prevalence of neural tube defects (Victoria, Western Australia, South Australia), 1998 to 2008, with 95 per cent confidence intervals, the AIHW fitted line y = 14.2 − 0.23x extended to 2026, and the expected range of year-to-year scatter (fitted line ± 2 SD of residuals, shaded). The diamond shows the acknowledged post-fortification rate from Hilder’s conception-period analysis (8.7 per 10,000, centred on 2010), which sits just below the lower edge of the band. Sources: AIHW baseline (PER 53), Figure 3.1 and Table A6.1; Hilder 2007 to 2011; projection and band on the same fit.
The projection to 7.8 per 10,000 by 2026 could well be wrong. Any falling rate eventually flattens. The band in the figure is the expected range of the series, the fitted line plus or minus two standard deviations of its own year-to-year scatter. Every pre-policy year falls inside it. The three-state series bounced from 14.4 per 10,000 in 2000 to 11.9 in 2003, a fall of about 17 per cent, then climbed back to 14.1 the next year, all without any intervention, which is why the AIHW only ever drew a fitted trend and never claimed a year-on-year effect. The acknowledged 8.7 sits just below the lower edge of that band, a small excursion at the margin rather than a clean break, and it comes from a series that includes the under-reporting New South Wales data and so sits lower to begin with. One data point that appears lower is not a decisive effect, especially when all subsequent data is kept away from the public domain.
The 2011 analysis did seem to show suggestions of a genuine effect with a decrease in non-genetic defects not seen in those related to genetic defects. Much emphasis was given to falls in subgroups like teenagers and aborigines but, when working with small numbers such subgroup analysis can be anomalous. Indeed, for mothers over 35 years there was an increase in incidence since the mandate.
Why aren’t they shouting about the success?
None of this is evidence that fortification did nothing. The subgroup effects among the hardest-to-reach women may well be real. If the success is genuine, why are they being so coy?