

FDA compared apples and oranges
The FDA have finally conceded that the mRNA vaccinations increase the risk of pulmonary embolism. The study that led to this conclusion had a very odd methodology. Using this same methodology other risks were dismissed in an unjustified way. There are two FDA studies which use this same methodology. The first reported on people vaccinated aged 12-64 years and the more recent publication was for those aged 65 years and over. The study on the younger population used insurance databases whereas for the older population it was a medicare database.The studies are repeatedly described as being “rapid” and even “near-real time monitoring” even though nearly two years had passed before they were published.
Imagine you want to see if the risk of a certain condition was higher after vaccination was introduced compared to before. Data from voluntary reporting systems can act as an alarm signal but an accurate measure is better derived from comparing how common the condition is to how common it was in the past.
Ideally, the total number of people diagnosed with the condition for a period after vaccination would be compared to a similar period in a previous year. The MHRA set out to carry out such analysis once a week because of the unprecedented nature and size of the rollout. They have not published any findings.
The FDA chose to only look for 28 days for most conditions. The tally was compared to a 28 day period pre-covid. No justification is given for this short window. For comparison, when the Pandemrix vaccine was rushed out for swine flu in 2009, there was an 8 month lag between vaccination and onset of narcolepsy that was so devastating for the young people affected. (Narcolepsy is a condition where there is sudden paralysis or sleep meaning that a normal life is not possible). It is now known that the spike protein circulates for at least 4 months after vaccination and there has been a post mortem study showing characteristic vaccine induced inflammation of the coronary arteries leading to death 4 months after the last dose. The FDA only looked at the risk for the first 28 days.
Let’s say there was a condition where there were more cases in that 28 day period than in a random 28 day period used as a control. This would be very concerning because of a phenomenon called the “healthy vaccinee effect”. People tend to postpone vaccination when they are unwell such that every condition would be expected to be less common in the period immediately after vaccination. To measure the size of this effect it is important to include conditions in the analysis for which there is no expectation of an association as a control. For example, this group included coeliac disease as a control diagnosis. The FDA did not include a control condition.
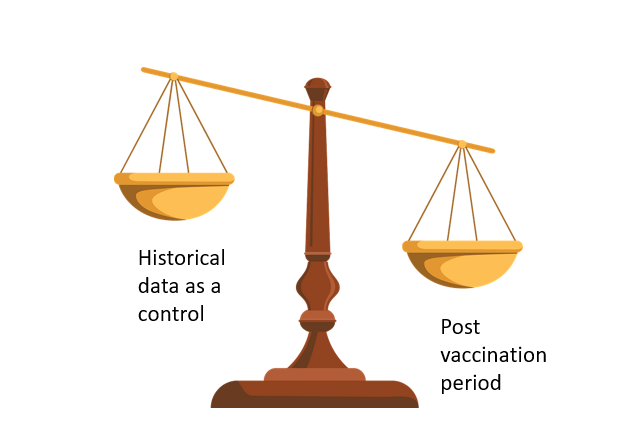
Figure 1: Hypothetical condition which is more common in period after vaccination than control period
The FDA methodology did not make a straightforward comparison. Instead they removed all the people who did have the condition but had not got a complete medical record for 365 days prior to the condition being noted. This might have been more justifiable if they had also removed people from the historical data who had not had an intact record for 365 days, but they did not.
They then removed all the people with the condition after the vaccine who had had a diagnosis of that condition in the 365 days prior to vaccination. They did not do the same for the control group.
If vaccination causes an increased risk of myocardial infarction, pulmonary embolism or other clotting problems then it would not be unreasonable to suspect that people who already had a propensity for those conditions would be at highest risk. Not only was their data removed but no separate analysis was reported for this group.
Having removed these people from the vaccination group the scales tipped such that there was only a slight difference between the control group (including people with bad records and previous history) and the post vaccination group (excluding those people). Even then the risk after vaccination was still higher in most of the groups analysed than in the control group.
The FDA then compared the vaccination group with data on people who had had an influenza vaccination. Again, they do not state that they excluded people who had not got an intact medical record or who had had that condition recently. Finally, they managed to tip the scale enough to claim that the vaccines were safe for myocardial infarctions and clotting issues but not pulmonary embolisms in the over 65 year olds. The rate of transverse myelitis was 4 to 7 times higher in those 12-64 year olds given Janssen (an adenovirus vaccine similar to Astrazeneca) but the FDA still concluded they “identified no safety signals.”
Figure 2 shows how they selectively used a population post influenza vaccination for only certain outcomes. They explain this saying,
“The comparator population was selected as either a general population or an influenza-vaccinated population depending on the background rates observed in these historical cohorts. If rates in the historical period differed from each other, as generally assessed by comparing the 95% confidence intervals (CI), we selected the lowest rate in order to enhance sensitivity of this monitoring; otherwise, the median annual rate was selected.”
However, where flu was selected as the control in figure 2 it clearly has a higher background rate.
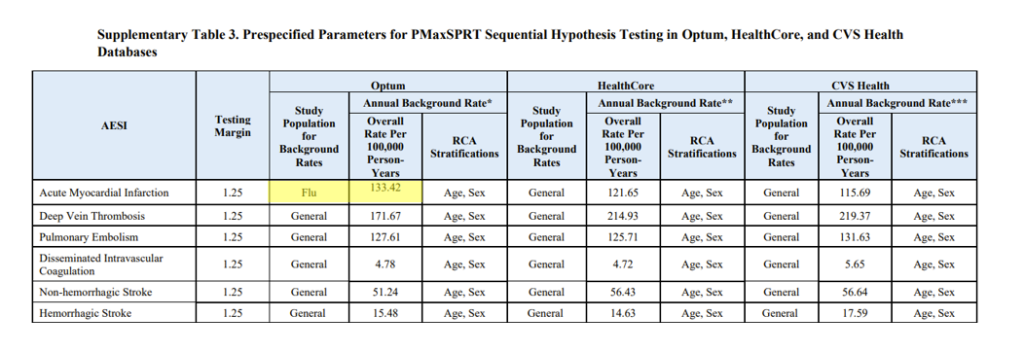
Figure 2: Table 3 from supplementary data on study of 12-64 year olds showing different a flu control selected to compare myocardial infarction outcomes
The period used for the background control group was also cherry picked depending on the condition.
“* All Optum background rates are based on 2019 rates.
** For HealthCore:
• Anaphylaxis, bell’s palsy, disseminated intravascular disease, transverse myelitis, unusual site thromboses (broad) with thrombocytopenia background rates were based on 2017 rates.
• GBS, encephalomyelitis, narcolepsy, hemorrhagic stroke, acute myocardial infarction and immune thrombocytopenia background rates were based on 2018 rates.
• All other outcomes background rates were based on 2019 rates.
***For CVS Health, appendicitis and narcolepsy are based on June-December 2020 rates; all other outcomes are based on 2019 rates”
The rate for appendicitis and narcolepsy in the CVS database was chosen despite it resulting in a higher background rate that could hide a problem, “For two outcomes (appendicitis and narcolepsy, both in the CVS database) where the peri-COVID rate (June – December 2020) did not return to pre-COVID rates, the peri-COVID rate was selected as the comparator “
Despite claiming that this study was designed to be sensitive to pick up signals that could be investigated further the methodology was designed to lack such sensitivity, “The test margin was selected for each AESI based on expert guidance to avoid minimal risk increases that were unlikely to be clinically relevant.”In the words of the FDA, “Active monitoring of safety outcomes following COVID-19 vaccination is critical to understand vaccine safety and can provide early detection of rare outcomes not identified in pre-licensure trials.” The way the FDA has carried out this analysis appears to be with a view to ensuring any signal present is hidden. Knowing that the FDA takes this approach to assessing safety is far from reassuring.
