

Increase in male mortality in 15-19 year olds should be investigated
Direct Mortality evidence
The mortality data for England and Wales from ONS from 1 May 2021 until 17 September 2021 shows a significant excess, particularly in the 15-19 year age group. Depending on the baseline chosen, the excess for 15-19 year olds is between 16% and 47% above expected levels (see table 1 and 2). COVID-19 deaths were too small in number to account for the excess. A disproportionate number of these excess deaths were in males. A certain amount of variation by random chance would be expected but an increase of this proportion is large enough not to be dismissed without further investigation.
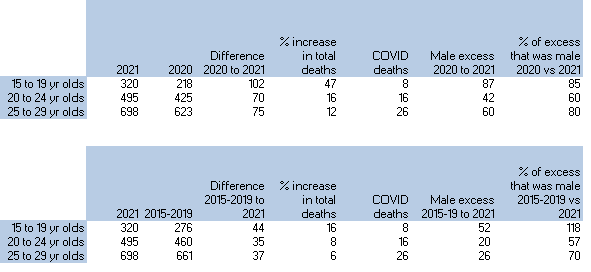
Table 1 and Table 2: Mortality from 1st May 2021 to 17th September by age group. Table 1 uses a 2020 baseline and table 2 uses a mean from 2015-2019.
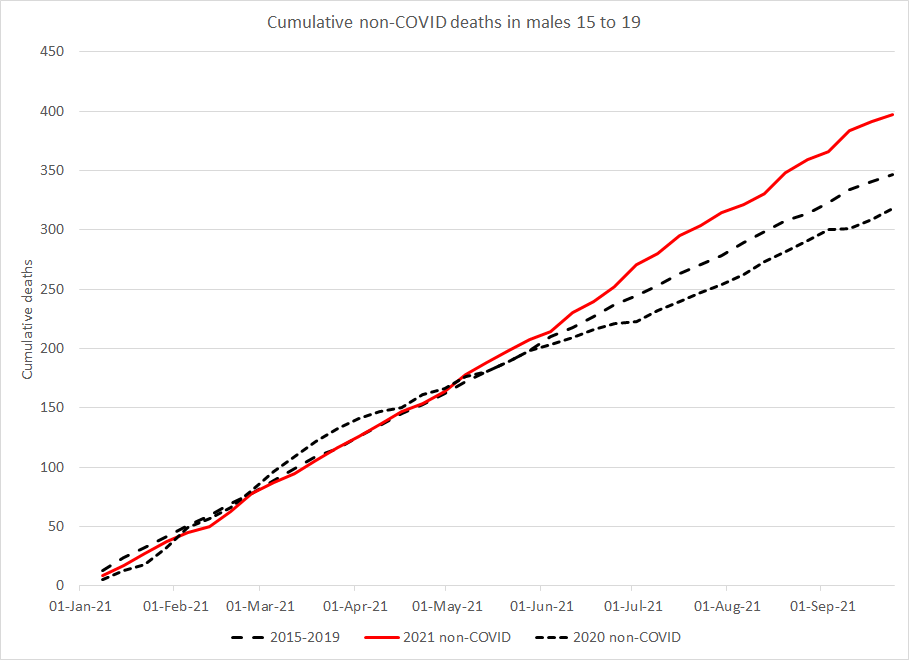
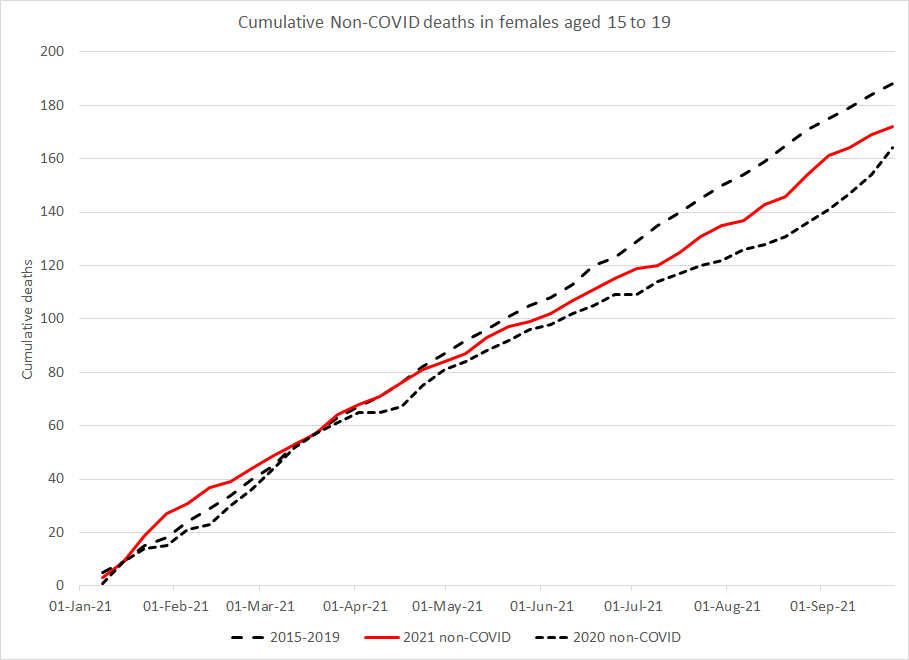
A clear deviation can be seen, beginning in May, for male deaths aged 15 to 19. Female mortality, on the other hand, shows a summer reduction more similar to 2020.
A similar magnitude of excess is seen in the 20-29 year old age groups compared to 2020, although background (2015-2019) rates are higher. Comparing just deaths in males aged 15-19 year olds, there were between 52 and 87 excess deaths (depending on baseline). This clear predominance of male deaths could be in keeping with known risks of myocarditis which has a bias to men and boys. In 2015-2019 males accounted for 65% of deaths in the 15-19 year age group, rising to 70% in 20-29 year olds. If the entire excess had been due just to random variation we would have expected 65% of the excess to have been male. However, there were too many male deaths to reach that conclusion. There were 21 male deaths in excess of what would be expected with a normal male female ratio (2020 baseline) or 25 male deaths in excess (2015-2019 baseline).
Male excess deaths were calculated by subtracting male deaths from the baseline figures for male deaths. For 15-19 year olds there were 52 excess male deaths from 1 May 2021 to 17 September 2021 compared to 2015-2019 baseline, however there were only 44 excess deaths in total. This implies that there were fewer female deaths than expected in this period if using the 2015-2019 baseline.
In contrast, for the Mortality data for England and Wales from ONS from 1 January 2021 until 30 April 2021, there were only a small number of deaths above expected levels, almost all of which could be accounted for as COVID-19 deaths.
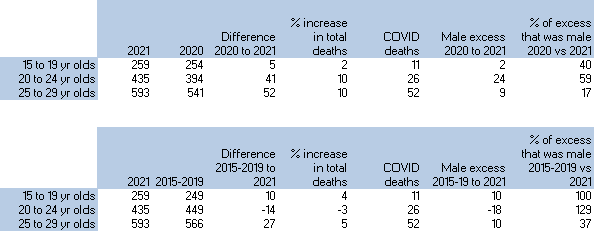
Table 3 and Table 4: Mortality from 1st January 2021 to 30th April 2021 by age group. Table 3 uses a 2020 baseline and table 4 uses a mean from 2015-2019.
Myocarditis
Although concerns have been raised about a variety of adverse reactions to vaccination, the most serious and common thus far is the risk of myocarditis. Myocarditis is a serious condition associated acutely with fatal arrhythmias, and chronically, because myocytes are irreplaceable, with heart failure and significant associated mortality. As the aetiology of Covid-19 vaccine-induced myocarditis is new it may be unwise to extrapolate the prognosis from what is known about myocarditis due to other aetiologies. However, in the literature the overall mortality rate for myocarditis after one year is 20% and after five years 44% to 56%.
The incidence of myocarditis after COVID-19 vaccination increased with decreasing age and was higher in males.
Indirect evidence of mortality signals
There has been a clear rise in ambulance cardiac and respiratory arrest calls in England and ambulance calls for people becoming unconscious starting from May 2021 (see figures 1a and 1b). There were two periods of heatwaves which may have also impacted on the rise for a short period, but in general the rise remains otherwise unexplained. The timing and extent of the heatwaves are evident in the data on ambulance calls due to the direct impact of heat (see figure 1c).
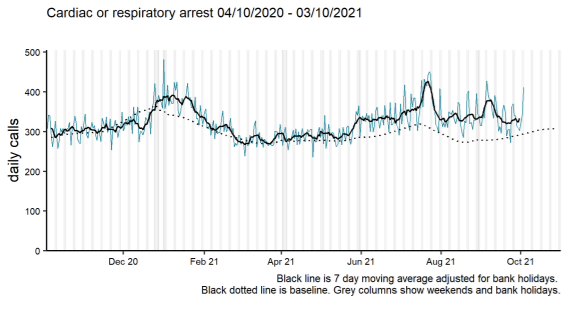
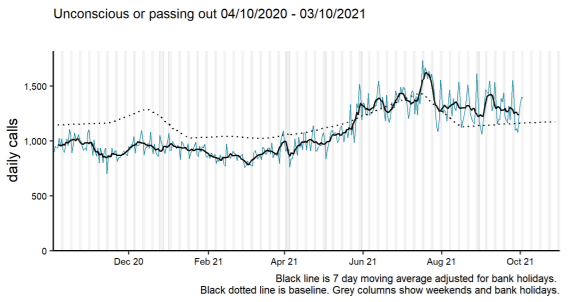
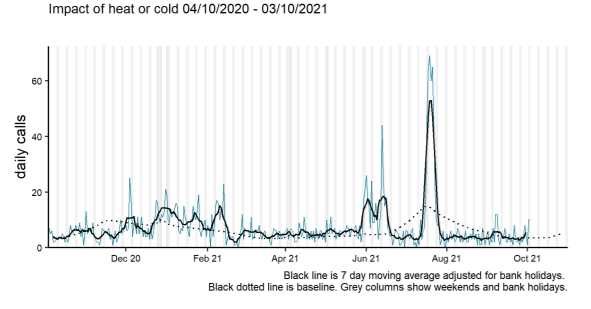
Figures 1a, 1b and 1c showing ambulance calls in England for cardiac and respiratory arrests (1a), unconscious patients (1b) and those impacted by heat or cold (1c)
Correlation with vaccination rollout
It is worth noting that the vaccine rollout began for vulnerable young people in winter so there isn’t a clear start date to look for an impact. However the clear majority of vaccinations were given in the 16 to 24 year olds from 1st May 2021 until recently.
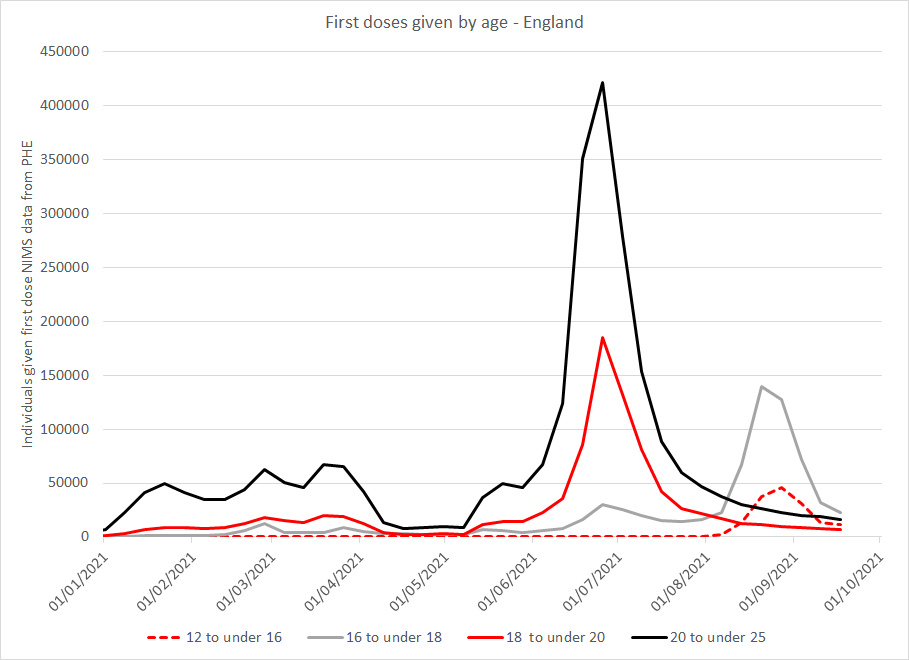
Figure 4 Daily first doses given by age in England
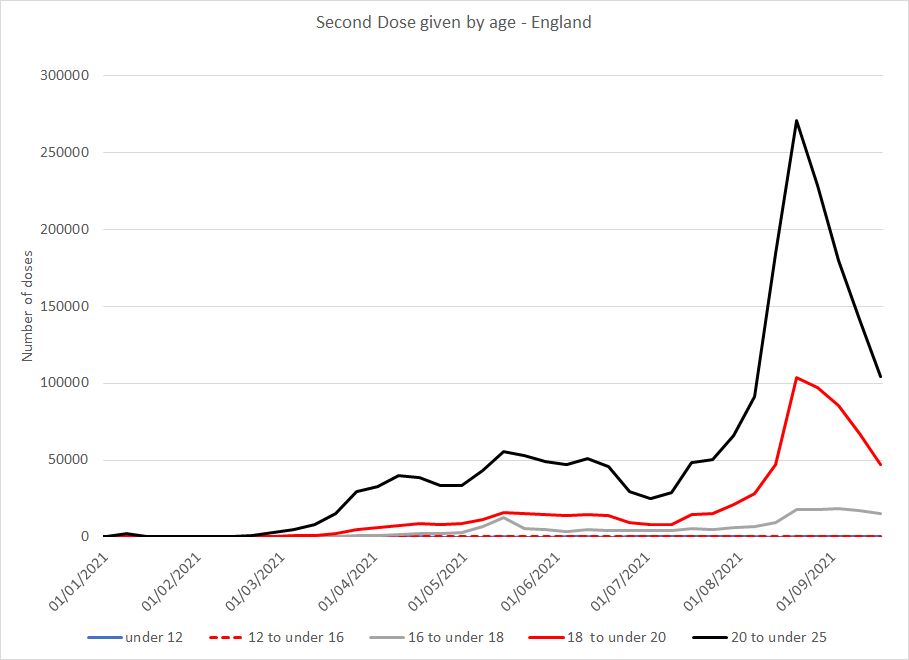
Figure 5 Daily second doses given by age in England
Ref for data to plot numbers of doses given per day by age (Fig 61 of spreadsheet):
The data from PHE used to compile the above graphs is a comprehensive national system, the National Immunisation Management System (NIMS). However, although a proportion of data is collected promptly, there is a lag of a few weeks before the whole data set is complete. This lag means that the downward sloping from the beginning of September may well be artefactual. Nevertheless, it is clear that the majority of vaccinations in this age group were given since May.
PHE collects information on the vaccination status of patients who are registered with an NHS GP as part of NIMS. ONS have this data and have linked it to their death data in order to publish their document “Deaths involving COVID-19 by vaccination status, England: deaths occurring between 2 January and 2 July 2021”.
The information linking vaccination status to the deaths data is therefore available.
In their report, the ONS did not release the raw data but instead gave mortality rates adjusted for age. In this way a death of a young person contributes more to the age-adjusted mortality rate than a death of an older person, because the background numbers of deaths in the former age group are so much smaller than in the latter. The data shared with their paper shows a dramatic rise in non-COVID-19 mortality rate in those vaccinated more than 21 days earlier with a first dose, beginning in April 2021 and escalating rapidly in May 2021. Although some 18 and 19 year olds may have received a second dose in August, the majority (78% according to week 38 reported data) of the vaccinated 12-17 year population have received only a first dose. Therefore they would be largely in the category of “vaccinated more than 21 days earlier with a first dose”. The age adjusted mortality rate for this group reached levels 60% higher than the peak mortality rate for unvaccinated people during the winter.
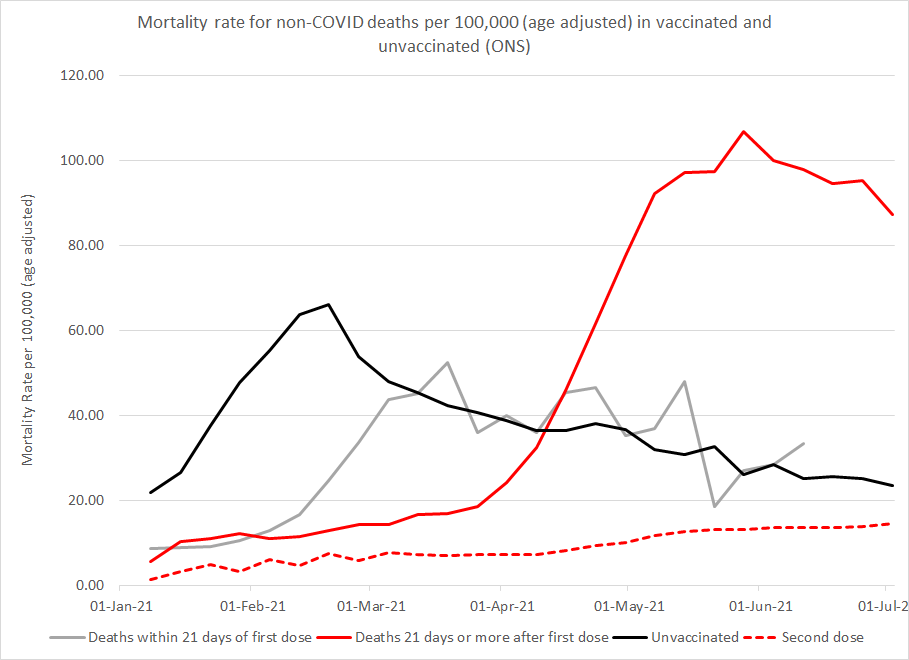
Figure 7 Age adjusted non-COVID mortality rates by vaccination status as published by ONS on 13th September
Ref for figure 7 (table 5 of their spreadsheet):
Summary
Mortality has risen in younger age groups since 1st May 2021. The increase in the 15-19 year old age group is particularly noticeable, especially as deaths in this age group are uncommon. The excess deaths have a marked male predominance. An increase in ambulance call outs for patients who have had a cardiac arrest or are unconscious showed a coincidental noticeable rise from May 2021. The period also coincides with the rollout of vaccination. Finally, ONS have reported on a striking rise in age adjusted mortality rates in those with only one dose that accelerated in May 2021 to levels far exceeding those in the unvaccinated.
Although there may be a number of explanations for these findings, further investigation of the cause of these deaths is warranted. The ONS death data and NIMS vaccination data have previously been linked. Without that link ONS could not have published on deaths after vaccination. Therefore, confirming the proportion of the 15-19 year olds that had been vaccinated should be possible.
