

Worrying data from the USA and UK
Much of the analysis around Covid 19 vaccine harms revolves around counts of deaths, and excess mortality. This is perfectly understandable since “excess deaths” is a “hard” measure in that most countries are able to count the number of their citizens who have died quite accurately so this does allow for some reasonably informative inferences and international comparisons.
The same is of course not the case for “covid deaths” which even the strongest proponents of the establishment covid narrative have had to admit are affected by differences between countries in classification, testing rates and, policies.
However, as well as many countries experiencing excess deaths, there is currently a second huge problem: marked increases in the numbers registering as long-term disabled.
Because registering as disabled is usually done for the purposes of receiving financial assistance or other support from the state, there is a built-in gatekeeping function which limits spurious claims, so we can be reasonably confident that any significant increases represent genuine medical issues.
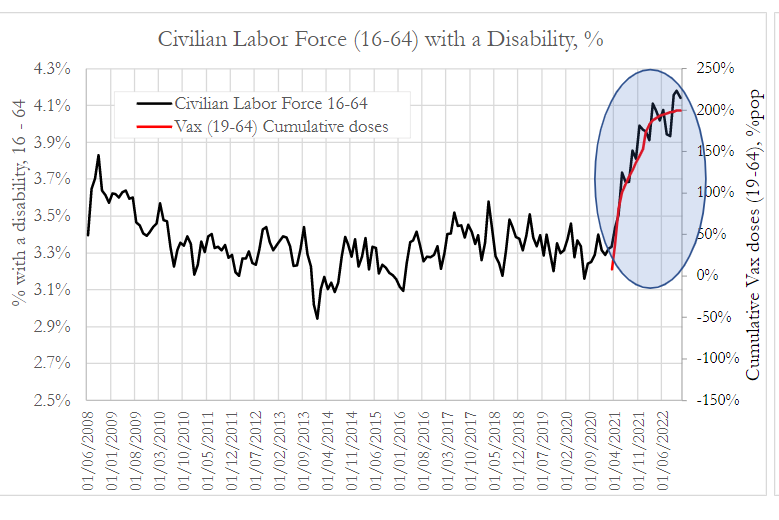
Looking at the USA first, a group called Phinance recently published an analysis of the proportion of the US civilian labor force who are registered as disabled.
This graph shows the % of workers aged 16 to 64 with a disability against the total number of Covid vaccinations administered in the same age group.
Phinance also published this graph which is a regression analysis showing a very strong correlation between the increase in the number disabled and the total number of doses given – something which actually is rather obvious from the above.
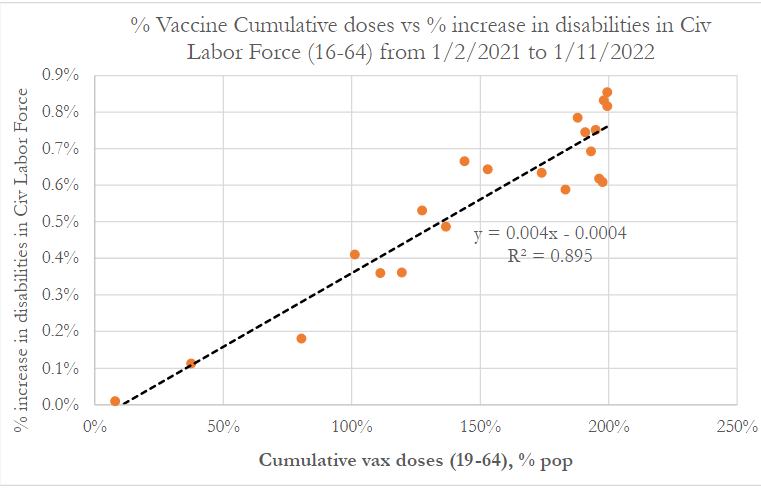
It is fair to point out that such a regression analysis should not in general be performed on cumulative series of data (ie total doses administered), but rather on discrete data (which in this case would be daily or weekly doses). If the measurements can only increase and not fall (as with cumulative data), this limits the significance of any correlation observed, as by default they will rise together.
This is less of a problem here in that only one of the 2 data points (vaccines) is cumulative (for the other axis they have used the increase in the number disabled). However, we wrote to the authors to ask why they didn’t use daily or weekly doses administered.
They responded with the not unreasonable point that because the adverse effects occur over a wide and variable period after dosing, a cumulative series is probably more informative. We agree. Just because fewer doses were given one week does not mean there were fewer people at risk of developing a post vaccination disability in that week.
The extremely experienced medical statistician who blogs as “John Dee” has performed further analysis on the US data above. The article is rather technical but in essence by applying a number of sophisticated statistical tools he concludes that using cumulative data may exaggerate but has not invalidated the findings, which should therefore be regarded as highly suggestive (though not in themselves proof of) a causal relationship.
However, the criticism of the statistical methodology was never really “on point” anyway. Science advances through testing hypotheses by questioning the available data.
The point of the analysis of the disability data was not to conclusively “prove” that the vaccines cause harm, but rather to answer the question: Is there a signal of potential concern which warrants further study? The answer to this appears to be “yes” and anyone finding excuses to not even look further should be regarded as willfully blind.
Of course, the link to vaccination could quite easily be further tested by ascertainment of the vaccination status of a representative sample of the disabled, with comparisons to disability rates in the unvaccinated. That this is not even being discussed must surely be regarded as a red flag.
When a potential signal of concern is replicated internationally, it increases the likelihood that we are dealing with a causal relationship. Not much quality data on disability rates is available from other countries, but one country which does publish some comparable data is the UK.
In the UK, if disabled, a state payment called a personal independence payment (PIP) can be claimed. An official UK government report states that there have been “unprecedented levels of new claims in recent quarters” (in England and Wales).
This has been reported by various news websites, including Yahoo’s article titled “The ‘astonishing’ rise in people claiming one key benefit”.
PIP data is actually downloadable from an official UK government website, and “John Dee” has performed some analysis on it which can be read here and here.
The new claims data plotted against cumulative doses administered looks like this (with thanks to John Dee for the graphs):
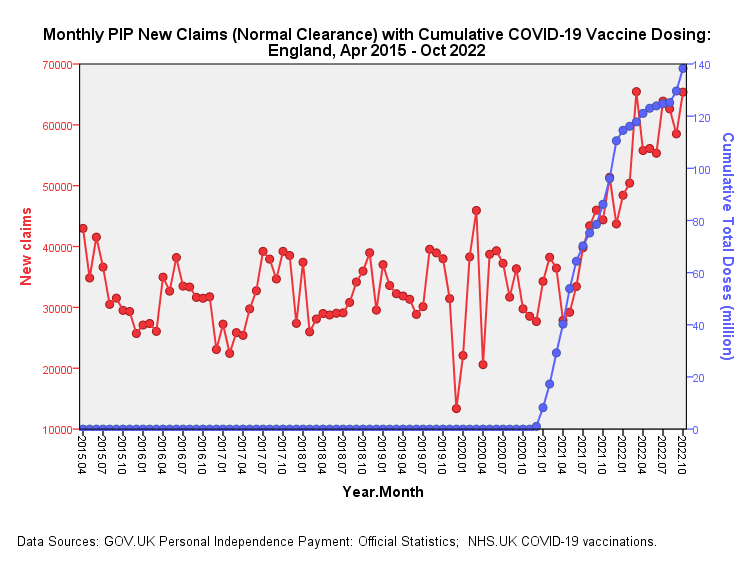
Clearly, this bears an uncanny resemblance to the US data above.
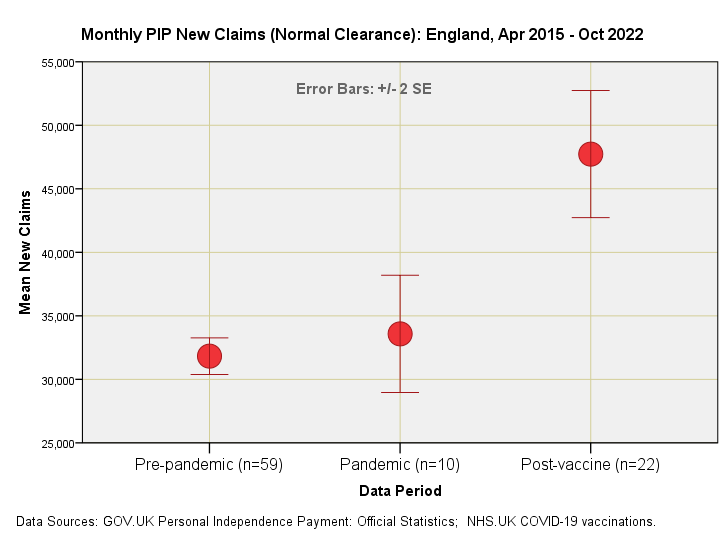
As he did with the US data, John has drilled deeper into the data, showing, for example that whilst claim rates in the pandemic period were similar to those in the pre-pandemic period, there is a huge uptick in the post-vaccine period, with the error bars (and statistical tests of significance) indicating that this is not just random variation.
Moreover, he has used a technique called “cross-correlation” which strongly suggests that “the increase in the month-on-month changes in total administered doses is followed three months later by a rise in month-on-month changes in new cleared claims.”
This would appear to add plausibility to the causation argument, in that three months is the period required by the government as a minimum qualifying period before an application for PIP can be filed.
Overall, these datasets surely raise huge concerns, which could be assuaged by further more detailed examination of the data, especially including vaccination status. We urge governments to carry out such an analysis, which need only be performed on a representative sample in order to generate reliable conclusions.
