

The government’s modelling of what flour we eat has a massive error
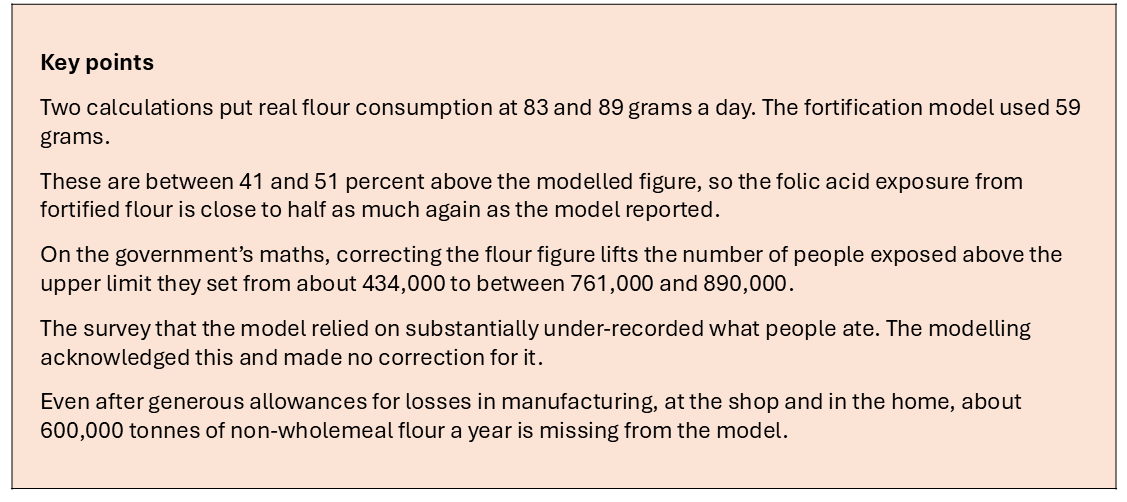
The dose for mandatory folic acid fortification was modelled on the assumption that the average person eats 59 grams of non-wholemeal flour a day. Following the milled national flour to its destination puts the real figure at 83 grams. Working up from the food people leave out of their diaries gives about 89.
The folic acid dose was decided based on this inaccurate modelled figure. The gap is huge.
The dietary survey the model relied on had an acknowledged inaccuracy. Recorded energy intake averaged about three-quarters of measured energy expenditure, and less than two-thirds among women aged 16 to 49. The modelling made no correction for it.
Let’s look at each calculation on its own, all based on the non-wholemeal flour that folic acid is being and will be added to and see what it means for the exposure dose.
Method one: the government’s own sense check
In June 2012, the Scientific Advisory Committee on Nutrition published a paper on the nutritional implications of repealing the bread and flour regulations. Their modelling used a diary-based estimate of 67 grams of flour a day. They then checked that figure, by starting from how much flour is milled and subtracting the flour that never makes it into a mouth. Their own note records that the two answers differ by 30 percent.
They began with annual flour production of 4 million tonnes, equivalent, they said, to about 180 grams per person per day. They deducted 5 percent for losses in manufacturing, leaving 171 grams. Then 10 to 12 percent at the retailer, leaving about 151 grams. Then 40 percent for waste in the home, leaving 90 grams. That is the figure they published.
It needs one correction before it can be compared with anything. Their production figure covers all food flour, wholemeal included. They were comparing two different things. Once non-food uses and wholemeal are removed from the millers’ 2011/12 figures, their own sum gives about 82 grams.
Method one gives 82 grams a day of non-wholemeal flour.
Two further things are worth noting. Their calculation assumes that roughly half of all the flour milled in the country is discarded rather than eaten, which is a very large assumption to rest on. And their own table gives two household waste figures, 40 percent for white bread and 32 percent for total bread. The sum uses the higher one. Had they used 32 percent it would have given about 94 grams rather than 82.
Method two: the secret trips to the biscuit tin
Dietary surveys record less than people eat and the amount that people hide can be measured. Doubly labelled water measures energy spent and can be compared to what people write down in a food diary. The food diary record could account for just under three-quarters of the calories that the water test showed were actually consumed. In other words about a quarter of what people actually ate was missing from the diaries, which makes true intake around a third higher than the recorded figure. Among women aged 16 to 49 more than a third of actual intake was missing, making what they ate more than half as much again as what they wrote down.
Taking the 59 grams a day figure, a straightforward proportional correction gives about 81 grams a day, within two grams of what the tonnage route produces. But there is a flaw in carrying out an adjustment like this. People admit to eating healthy food and assuming that the food they hide is as proportionately healthy as the food they write down is quite naïve. It is the trips to the biscuit tin that are the calories that are hidden and these will be disproportionately high in flour.
So how much flour is in the secret consumption? Much of the unrecorded energy carries no flour at all. Alcohol is the clearest case, with surveys capturing only 40 to 60 percent of what is sold which on my own calculation leaves roughly 60 to 70 calories a day unrecorded. Sugar-sweetened drinks, chocolate and sugar confectionery and cooking and spreading fats are the other large omissions, on the survey’s own analysis of which foods go unrecorded. The flour-carrying share is real. I have conservatively assumed it is only half of the gap, not all of it.
Under-reporting is also selective in a way that points at flour. Poppitt and colleagues watched 33 women eat in a metabolic unit for 24 hours, then asked them to write down what they had eaten. Meals were reported accurately. What went missing was the snacking between meals and with it carbohydrate and added sugar. Reported protein and fat did not differ significantly from what was measured. It is a small study, but it points where you would expect. At the biscuit tin.
An adult who consumed 2,400 calories writes down about 1,800 calories leaving 500 to 700 unrecorded. Taking flour baked goods as half of those secret calories, for the reasons just set out, gives 300. The government’s own flour contents put biscuits at 35 percent flour by weight, cakes and pastries at 27 percent and white bread at 52 percent. Flour is less energy dense than the fat and sugar packed around it, so across a mixed basket of these foods flour supplies roughly a third of the calories. That is about 100 calories of flour, or 30 grams. Added to the 59 grams the model counted in the food diaries, that gives 89 grams.
On these assumptions, method two gives about 89 grams a day.
Biscuits and cakes are key to the correction. They use about 15 percent of the nation’s flour in 2011, 12.6 percent for biscuits and 2.7 for cakes, and 11.4 percent on the latest figures. They are among the products people most often leave out of a food diary. The advisers even listed under-reporting of biscuits and cakes as one possible reason their own reconstructed intake fell short. However, they ignored this correction, on the ground that household purchase data gave a similar figure, and settled instead on higher wastage during manufacture as the likelier explanation. Their own note concedes they had no information on that wastage at all. I have not found a later estimate using the same method, but they quoted 32% as for white bread.
Method one, brought up to date: the same sum, with the latest figures
The advisers’ sense check was done in 2012. Two things have changed since. Less flour is milled and it is spread across more people. Both push the total flour consumed down. Here their own sense check is repeated on the most recent published figures.
Although around 5 million tonnes of flour is milled in the UK each year the millers report gives its most recent detailed breakdown as an estimate for 2021/22: total production of 4.65 million tonnes, with 18.7 percent going to starch manufacture and other non-food uses. That leaves about 3.8 million tonnes of food flour, which spread across the population is 152 grams a head a day. Wholemeal breadmaking is 4.3 percent of total production, or 5.3 percent of food flour, and is taken out at the end of the sum below.
The government ignored imports and exports on the basis that they were of similar magnitude. It has not been possible to find data to support that claim but we have taken the same approach. Imported flour falls within the mandate; imported finished products containing flour do not.
Flour is lost during manufacturing. Dough is trimmed, flour is dusted onto boards and swept up, there is spillage, batches fail. The advisers used 5 percent for this and put no figure on it beyond that.
Flour gets thrown in the bin. Bakery products are among the most wasted food categories in UK households, behind fresh produce and meals, on WRAP’s latest survey.
This is where the 2012 sum and the current one part company. The 40 percent household waste rate the advisers used came from a survey of bread published in 2010. It was then applied to everything else, including biscuits and packaged cakes, which generally keep far longer. Their own note concedes they had no information on wastage for products other than bread. Reconciling the two figures requires the bold assumption that nearly half of edible flour ends up in the bin.
I have used their own 32 percent wastage figure for total bread. At that rate the two answers are 94 grams and 83.
| 2012, as the advisers did it | 2021/22, the same sum | |
| Food flour, after non-food uses removed | 4.0 million tonnes | 3.8 million tonnes |
| Population | 61 million (implied) | 68.3 million |
| Flour available per head | 180 g a day | 152 g a day |
| Less waste at the bakery, 5 percent | 171 | 145 |
| Less waste at the retailer, 10 to 12 percent | 151 | 128 |
| Less waste in the home | 32 percent → 103 | 32 percent → 87 |
| Less wholemeal, which is not fortified | 8.5 percent → 94 | 5.3 percent → 83 |
| Non-wholemeal flour eaten | 94 g a day | 83 g a day |
The same sum, a decade apart, at their own 32 percent waste rate. Less food flour is milled and it is spread across more people, so the answer now comes out lower than in 2012. The production figures are the 2021/22 estimate and the population is the mid-2023 estimate; aligning both on 2022 moves the answer by less than a gram. The 180 grams the advisers used implies a population of about 61 million, below the 63.7 million living in the UK in 2012, so their starting figure was if anything generous.
Updating method one gives 83 grams a day of non-wholemeal flour.
That is lower than 2012 but think about what it means. The average flour consumption has fallen as more people avoid bread. A falling average is not the same as fewer people at risk. Nothing about a falling national average, where one end of the spectrum stopped eating bread tells us that those at the higher end of bread consumption have changed their habits. If some people have given up bread while the rest eat as much as ever, the average drops and the number at risk does not.
Two methods, one answer
The advisers’ own sense check, brought up to date and put on a non-wholemeal basis, gives 83 grams. The hidden calories, working up from what people fail to write in a food diary, give about 89. The model that decided the folic acid dose used 59.
The two are not drawn from the same evidence and provide a sense check for one another. One works down from national flour tonnage and its waste rates. The other works up from food missing from dietary diaries and ignores tonnage and waste altogether. They land at 83 and 89 grams, between 41 and 51 percent more than the figure the dose was decided on, and a simple proportional correction for under-recording lands at 81. The advisers called their production-based result an upper limit for the contribution of flour to the diet. It was reached by applying the higher of their two household waste figures, the 40 percent recorded for white bread, to every flour-containing product, while their own note states that waste of those other products is unlikely to exceed that of bread. Of all the assumptions available, they chose the one that minimises consumption estimates.
What that does to the dose
At 83 to 89 grams, exposure to folic acid from flour is between 41 and 51 percent higher than the government’s model allowed for. Despite acknowledging the under-reporting the modelling did not correct for it, in order to stay comparable with the 2006 exercise and on advice from Public Health England.
The report calculated what proportion would exceed the safe upper limit. That limit is not a threshold below which every possible harm has been excluded. The expert group could not set a Safe Upper Level at all, because the data were not sufficient to support one, so they issued a ‘Guidance Level’ instead. This relies on a single adverse effect, neurological damage associated with masking vitamin B12 deficiency. Other possible effects were reviewed, and in each case the evidence was judged insufficient to quantify or to bring into the numerical limit. The government’s ceiling therefore reflects the one harm that could be assigned a number rather than the range of what fortification might do.
If their model was right, their policy of fortifying all non-wholemeal flour at 250 micrograms per 100 grams puts 0.635 percent of the population above that limit, about 434,000 people. At the lower estimate of 83 grams that is 41 percent more flour, which has the same effect on the dose as raising the concentration from 250 to about 350 micrograms. The report’s own table puts 1.114 percent above the limit at that level, about 761,000 people. That assumes under-reporting is spread evenly across the distribution because we cannot access the individual food diaries the calculation was based on. What is known about under-reporting points to it being greatest among the heaviest consumers, which would place more people above the limit than an even correction implies, not fewer. On the higher estimate of 89 grams the equivalent concentration is nearer 380 micrograms and the same table gives about 1.3 percent, or about 890,000 people. The table stops at 450 micrograms and the curve steepens as it climbs, so reading in a straight line between its points understates rather than overstates.
Even that is a floor. Any food below 4 percent flour by weight is treated as having none, on the grounds that the amount is minimal: the flour dusted onto grated cheese or onto rice to keep it from clumping, the thin coating that crisps an oven chip, the one or two percent that turns up in countless products. A few genuinely fortifiable items are set aside as well, chiefly wheat crackers and crispbreads and the pastry in quiches and flans. And people under-record everything they eat, not only flour, so the folic acid in fortified breakfast cereals, spreads and supplements is under-counted in the same way.
The worst case
For a novel virus, the government models a reasonable worst case, taking the highest plausible susceptibility and fatality rate and planning against it. For something that cannot be controlled that is not a sensible approach. An intervention is different. Fortifying the nation’s flour is entirely within the government’s control and it is there that the caution disappears.
Mandatory fortification exposes almost the entire population and in those circumstances the model should have tested the highest plausible intake and shown decision-makers the resulting risk. Instead, it kept an exposure estimate its own survey had shown to be too low and used it uncorrected. The consequence is that the dose reaching people will be between 41 and 51 percent higher than what the policy intended.
Check out the rest of HART series on Folic acid here.
Sign the parliamentary petition and demand a proper debate.