

Reduction in deaths last winter compared to spring does not stack up
Government has published a winter plan for care homes with plans for interventions for this winter in care homes including ipads as a proposal to replace human contact. The entire document is based on the premise that interventions in winter prevented deaths in care homes based on claims made in a review of last year’s winter plan. No data supports this notion. The Government report is either based on a terrible error or a deliberate lie.
Care homes were not as full in winter as in spring so measuring excess mortality gives a distorted view. The same review admits that a reduction in care home residents makes comparison of absolute numbers unreasonable and instead they choose a reasonable measure of the percentage of total care home deaths that were due to covid. Having chosen this sensible measure they go on to claim it shows fewer deaths in winter than in spring.
“But while COVID-19 accounted for around 40% of all deaths of care home residents between April and June 2020 in the first wave of the pandemic, it accounted for only a quarter (26%) of all care home resident deaths between September 2020 and February 2021 in the second wave.”
Figure 1 shows that this measure actually demonstrates winter saw a far higher proportion of ‘covid deaths’ in care homes than would have been expected from the overall trajectory.
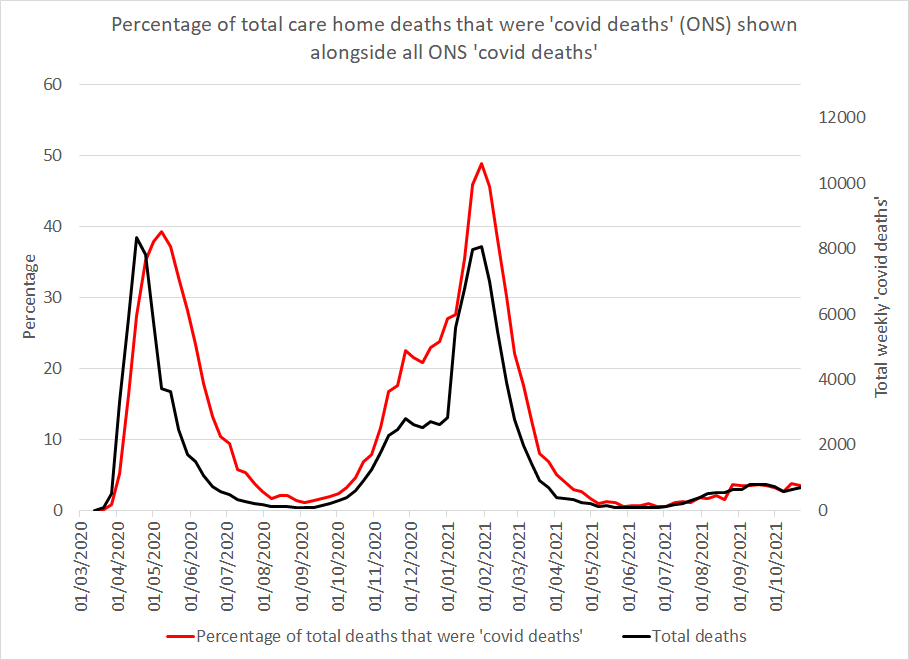
The claim of covid accounting for 40% of care home deaths in spring 2020 is very wrong. Care home deaths mentioning covid reached 39% for one week ending 8th May 2020, but the overall percentage for April to June was only 29% not 40% as claimed. By excluding March deaths the percentage in spring appears larger than if the whole wave is included which brings it down to 24% (see table 1). In contrast, from 16th January to 5th February levels were above 40%, peaking at 49% in the week ending 29th January 2021.
By excluding the beginning of the first wave the percentage of total care home deaths that were attributed to covid becomes inflated (see table 1).
| 1st March to 3rd July ONS deaths in care homes | 4th April to 3rd July 2020ONS deaths in care homes | 10th April to 3rd July ONS data of deaths of care home residents at any location notified to CQC | 29th August to 26th FebruaryONS deaths in care homes | 29th August to 26th ONS data of deaths of care home residents at any location notified to CQC | |
| Total deaths | 59,523 | 48,968 | 49,435 | 62,760 | 73,358 |
| ‘Covid’ deaths | 14,282 | 14,075 | 18,438 | 14,424 | 19,576 |
| % of deaths that were ‘covid’ deaths | 24% | 29% overall (39% at peak) | 37%(excluding first six weeks of wave which are not published) | 23% overall(49% at peak) | 27% (26% according to gov) |
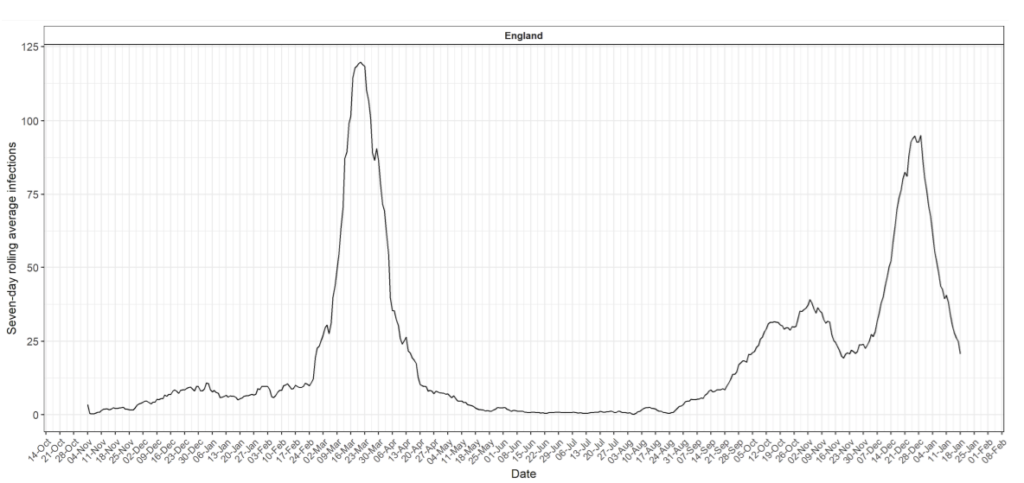
A further sense check can be carried out by comparing the overall trajectory of the pandemic through different measures and seeing if the care home death data has a different trajectory. REACT carried out a study of a large random sample of the population, testing them for antibodies and asking more than 10,000 with naturally acquired immunity when they had symptoms. The size of the two waves can be compared using this study. The definition of the second wave has to be restricted to symptoms occurring before 31st January as the study ended after that period. Comparing the two waves, the numbers affected in the first wave was 42% of the total.
An estimate of the numbers affected based on PHE’s testing of blood donors for antibodies reaches the same conclusion. The ONS care home deaths are an outlier with 50% occuring in spring.Adding in the deaths of care home residents that occurred outside of care homes, the percentage is 47%. Including these deaths, the proportion of deaths in winter compared with spring was more similar to other measures of the trajectory of covid in the community including the numbers who had symptoms in the REACT study and the numbers who developed antibodies according to PHE data. The small remaining difference in the proportion dying in winter vs spring is highly likely to be accounted for by the significant reduction in total care home residents over winter because of fears of covid and visitor restrictions. Non-Covid deaths in care homes over the same period were only 46k whereas the usual expected number from 2015-2019 would be 64k.
| Spring 2020 | Autumn and Winter 2020/21 | |
| Symptomatic cases with antibodies from REACT study (1/2/20 – 1/7/20 and 1/8/20 – 31/1/21) | 42 % (3432 ) | 58% (4714) |
| Antibody positivity in July 2020 and February 2021 based on population estimates from blood donor sample | 42% (3.7M (6.5% of population)) | 58% (5.2M (9.2% of population)) |
| Total ONS recorded deaths (24/2/20 – 24/7/20 and 22/8/20 to 26/02/21) | 39% (48,445 ) | 61% (74,275) |
| Deaths that occurred in care homesONS recorded care home deaths (24/2/20 – 24/7/20 and 22/8/20 to 26/02/21) | 50% (14,529) | 50% (14,447) |
| Deaths of all care home residents in ONS weekly deaths record plus those who died elsewhere and were reported to CQC(10/4/20 – 3/7/20 and 22/8/20 to 26/2/21) | 47% (17,889) (excludes first few weeks when there were 975 deaths in care homes) | 53% (19,868) |
There was a significant problem with hospital transmission in winter. Whether care home residents caught covid before or after admission to hospital is actually immaterial. The point is that with restrictions in place the end result, of people dying, was the same as in spring 2020.
In spring 2020, minimal changes had been made to how care homes were run and many had no PPE. The fact that the same proportion of covid deaths occurred as would be expected based on rates of symptoms and seroprevalence in the community indicates that none of the interventions put in place over winter had an impact. These restrictions were brought in without any discussion with residents and have had a hugely detrimental effect on the quality of the short amount of life left for these care home residents. There is no denying that covid presents an increased mortality risk for care home residents, particularly in winter. The fact this is true does not justify interventions that do not work. Wanting to do something is not justification either. There is no justification for reintroducing them.
