
Are asymptomatic positive PCR results a marker of testing failures?
After months of UK Government advertising making the dubious claim that 1 in 3 people have asymptomatic Covid-19, is there any supporting evidence of this? For a year PHE have published the percentage positivity rate for symptomatic and asymptomatic people being tested. From this we can calculate the numbers of symptomatic and asymptomatic PCR positives as described in the addendum below.
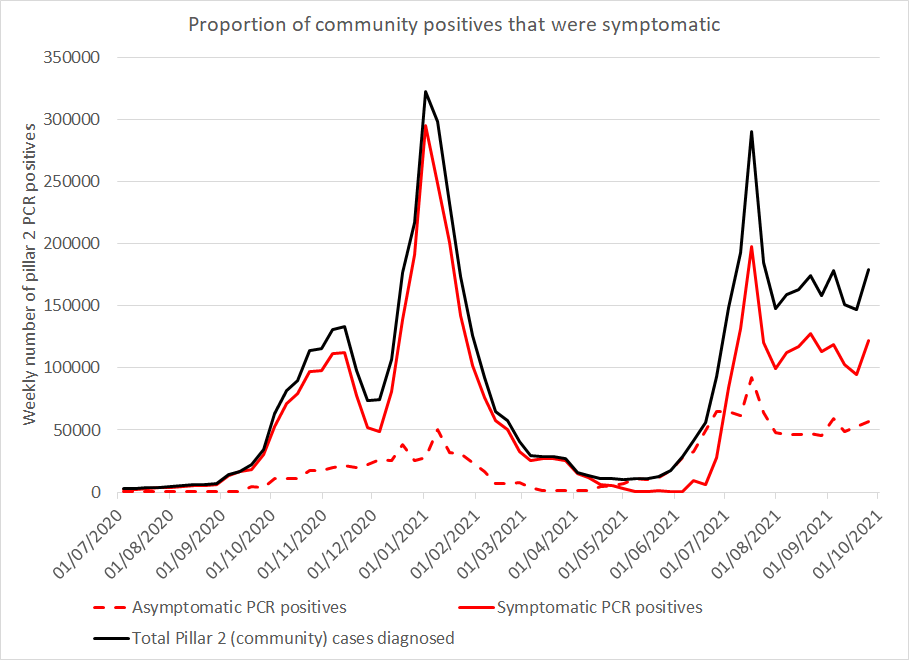
Figure 1: Total number of PCR positives from pillar 2 (community) testing (PHE data) by symptomatic status showing almost all positives were asymptomatic in April, May and June. Calculations described below.
Of those diagnosed in the community through Government testing a steady 10-20% had no symptoms until March 2021. There were two periods, in September 2020 and March 2021 when over 90% of the positives diagnosed were symptomatic. Where had the asymptomatic positives gone?
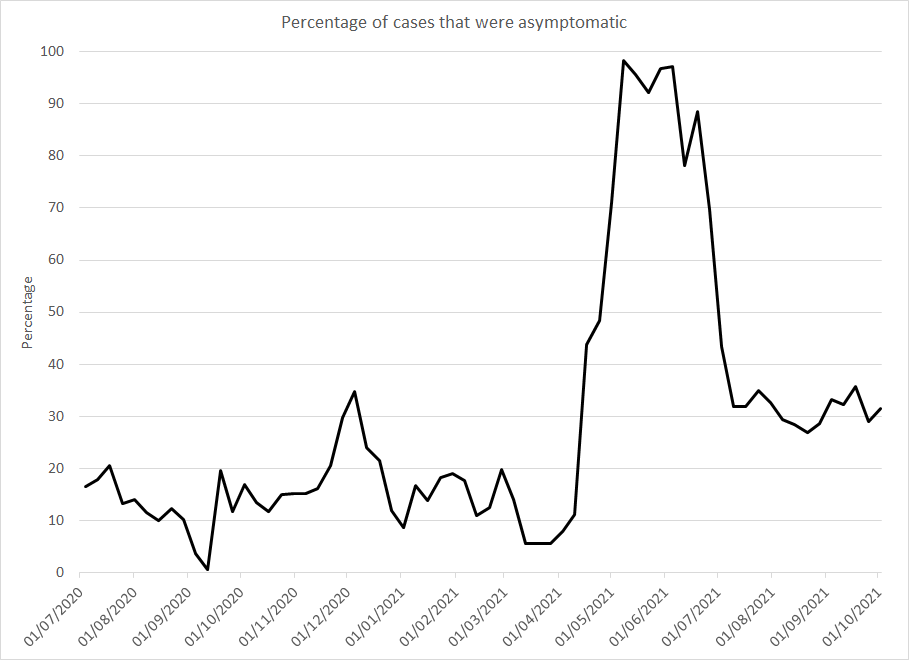
Figure 2: Percentage of positive PCR test results in pillar 2 (community testing) that were asymptomatic
Symptomatic COVID-19 almost disappeared for April, May and June 2021. As a result, almost all PCR positives were asymptomatic for these three months. Are we meant to believe that these were genuine cases at a time when there was no symptomatic COVID-19
around, or were these meaningless positive test results?
With Delta the proportion of PCR positives has indeed finally risen to near to the Government’s 1 in 3. However, ONS data and ZoeApp data would suggest that in the general population the proportion is much lower. How can a sample selected for testing, many of them because they are symptomatic, have a higher rate of asymptomatic positives than a random selection of the general public?
Moreover, can we really believe that a testing programme based on symptomatic testing manages to find the same proportion of asymptomatic positives as are present in the wider population? Over a whole population, this could only be the case if it was impossible to identify Covid-19 symptoms… which is beginning to become Kafkaesque, as the symptoms of Covid-19 are now well-known.
A more likely explanation is that perhaps asymptomatic positives are actually a measure of the accuracy of the testing system. If so, testing has deteriorated markedly in the last 6 months.
There have been 1.47 million asymptomatic ‘cases’ diagnosed in the community (pillar 2) since July 2020. The stage is set: will the authorities find evidence of increased “reinfection” in the coming months?
Importantly — and given the inherent flaws of the testing system outlined above — if the initial infection was asymptomatic then we ought to be rethinking what we mean by “reinfection”. Although asymptomatic Covid-19 has been discussed for 18 months as if it were a feature of the disease, studies have demonstrated between 4% and 76% of people tested never had symptoms. PHE data shows the range is even bigger from 0.5% to 98%. If it was a feature of disease, like a cough, it would be a constant. Asymptomatic positive test results are meaningless from a public health perspective. They cannot put pressure on the healthcare system, and there is no conclusive evidence that they spread disease and there is no evidence that asymptomatic people testing positive develop a new immune response which would provide protection from future infection. They are meaningless positives, due to testing identifying incidental virus and it is high time that the authorities stopped reporting them.
Addendum: Calculations
PHE does not publish the number of symptomatic or asymptomatic ‘cases’ but they do publish the positivity rate for people tested with or without symptoms. Combining these percentages with the overall positivity rate for pillar 2 testing gives us the proportion of positives that had symptoms. For example, in week 34, testing had an overall positivity of 13.3%. This was made up of 26% symptomatic people, 37% of whom tested positive and 74% asymptomatic people, 5% of whom tested positive (0.26 x 37 + 0.74 x 5=13.3). This calculation gives a percentage of positives who had symptoms each week, but it is an estimate due to the aforementioned lack of raw data from PHE.
