

Clarifying the real-life picture
The official narrative claims that vaccines prevent infection and therefore reduce risk of myocarditis from infection. This claim is reliant on two points:
- Vaccines reducing infections
- That infection related myocarditis occurs at a lower rate in the vaccinated
What evidence are these claims based on?
There is no shortage of groups with access to large scale health data enabling them to provide a myocarditis incidence rate for the following situations:
- Pre-covid background
- Uninfected unvaccinated
- Infected unvaccinated
- Uninfected vaccinated
- Infected vaccinated
Instead of providing this data these groups have fudged the answer in various ways. Some have avoided the question of incidence in the unvaccinated; ignored the vaccination status of those infected or even modelled the data in the vaccinated infected and not released the raw data.
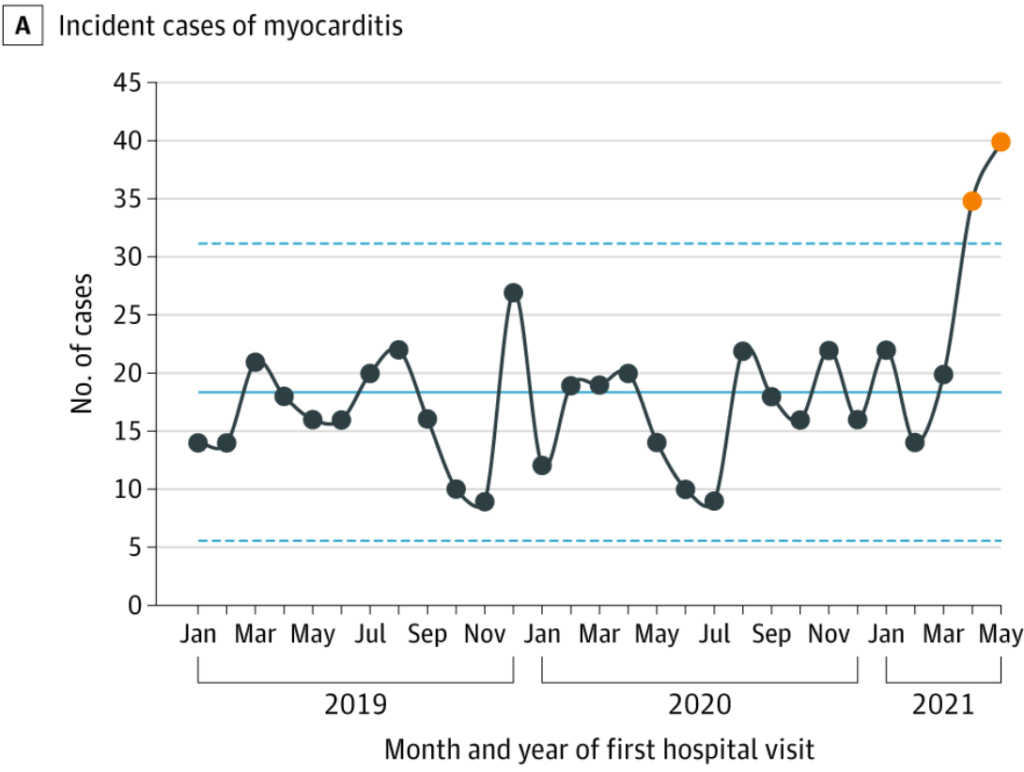
A single study using data from forty US hospitals, has addressed the question of how myocarditis incidence has changed over time. They showed that the rise in myocarditis did not begin until spring 2021.
By collating all the available studies we can assess the incidence rate for each of the situations described above. The table shows the incidence for the different groups in the order the papers were published. Where no distinction was made regarding vaccination status or infection status the cells have been merged. To allow fair comparison, where follow up was for more than a month, the numbers have been adjusted to a 28 day window.
| Date | Background rate | Uninfected Unvaccinated | Infected Unvaccinated | Infected vaccinated | Uninfected vaccinated | Reference and comments |
| Jan 2021 | Not mentioned | Not mentioned | Background risk only | Not mentioned | Not mentioned | Review of case reports |
| Jun 2021 | 2 in young males | Not mentioned | Not mentioned | Not mentioned | 67 in young males | FDA slides – for 7 day window after 2nd dose |
| Jun 2021 | Not mentioned | Not mentioned | Not mentioned | Not mentioned | 160 in young males | Israel – no time frame |
| Jul 2021 | Not mentioned | Not mentioned | 450 in young males | Not mentioned | Not mentioned | US – did not know how many infected and had to guess denominator and counted for up to 82 days after infection |
| Nov 2021 | 8.7 | Not mentioned | Not mentioned | Not mentioned | 337 in young males | Hong Kong – active 14 day follow up after vaccination |
| Nov 2021 | Not mentioned | Not mentioned | 50,000 | Not mentioned | Pfizer sponsored study – no claim to have correct denominator | |
| Dec 2021 | Not mentioned | Not mentioned | Not mentioned | 40 in <40 yr olds | 5 to 23 in <40 yr olds | Oxford – estimate of excess in 28 days |
| Jan 2022 | Not mentioned | Not mentioned | Not mentioned | Not mentioned | 106 in young males | USA in 7 day window |
| Jan 2022 | Not mentioned | Not mentioned | Not mentioned | Not mentioned | 70 in young males | CDC slide 13 – 7 day window |
| Feb 2022 | 2 in young males | Not mentioned | Not mentioned | Not mentioned | 162 in young males | US data – 7 day window |
| Feb 2022 | 70 | Not mentioned | 380 | 580 | Not mentioned | US Veterans – Ignored first 30 days – numbers calculated for annual risk here |
| Apr 2022 | Not mentioned | 8 to 10 in young males | Removed from study | Removed from study | 40-280 in young males | 4 Nordic countries |
| Apr 2022 | Not mentioned | Not mentioned | Not mentioned | Not mentioned | 100 | Pfizer consent form |
| Apr 2022 | Not mentioned | 8 | 8 | Not mentioned | Not mentioned | Israeli – based on maximum follow up of 6 months |
| May 2022 | Not mentioned | Not mentioned | Not mentioned | Not mentioned | 198 in young males | Public health Ontario |
| Jun 2022 | 5 | Not mentioned | 1500 – (unreferenced) | Up to 69 in young males | MHRA estimates |
The Pfizer sponsored study is a clear outlier with a claim of 5% of covid infected patients having myocarditis. The paper did not claim to have a reliable denominator as it was based on healthcare records and therefore biassed towards patients who needed medical attention. This figure and the unreferenced MHRA claim are in no way consistent with the change in incidence over time nor with the other studies.
The background rate is up to 8 per million per 28 days. The rate in the uninfected unvaccinated was similar. The unvaccinated infected rate was calculated separately on three occasions with measures ranging from background rates to 31 per million per 28 days. The figure of 450 per million was based on a modelled denominator. The follow up was for up to 82 days but the distribution in that time did not appear to be constant making it difficult to interpret.
The myocarditis rates in the infected vaccinated population ranged from 40 to 280 based on three separate studies. This is between 5 and 35 times higher than the background rate and 9 and 35 times greater than in the infected unvaccinated. The rates for uninfected vaccinated young men overlaps with the rates after infection in the vaccinated but includes estimates that are higher. The rate from the Hong Kong study of 337 per million is particularly notable as this was measured by actively following up those vaccinated rather than measuring passively or only capturing those that presented to hospital later.
The evidence that infection presents an increased risk of myocarditis in the unvaccinated is conflicting but even those studies that claim an increased risk in this group show it is lower than for the infected vaccinated. Vaccination itself presents a significant risk, especially in young males and the risk after infection in the vaccinated is higher than in the unvaccinated.
