
But the timing doesn’t fit long covid
The ONS have published their survey data on the number of working aged people who are economically inactive. The levels are higher than in the past and many commentators were quick to blame the rise on long covid. It is worth looking a little more closely before jumping to that conclusion.
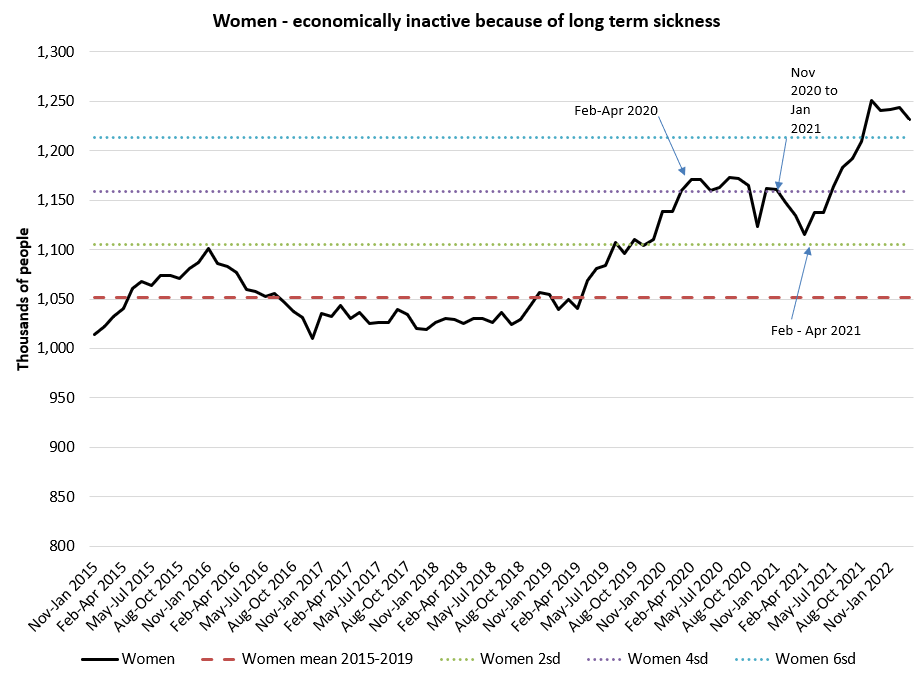
The rate of those economically inactive due to long term sickness had been rising among women since the beginning of 2019 (see figure 1). Rather than causing a further rise, the arrival of covid was actually associated with a plateau in the numbers which was sustained until November 2020, before then falling.
From February 2021 the rates began to rise again, continuing to rise until October 2021 when they again plateaued. The rates are so high currently that they exceed the blue dotted line which represents six standard deviations from the mean. Put differently, compared to the 2000-2019 baseline, levels this high would be seen by chance only 3.4 times in a million.
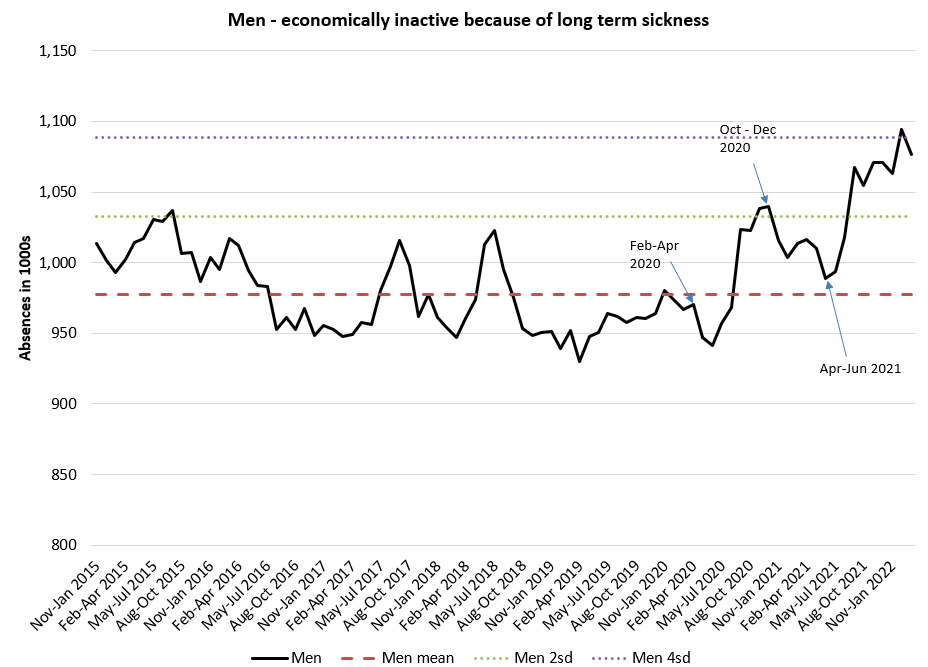
For men, the levels remained much more stable in the lead up to March 2020. There was a rise between May and October 2020 but this appears similar to deviations from the mean that have occurred before. However from May 2021 the rise was more extensive breaching the purple dotted line which represents four standard deviations from the mean, levels which, compared to the 2000-2019 baseline, would be seen by chance only one time in a thousand.
Similar findings have been seen in the disability claims data from the USA.
The lack of rise in long term sickness until spring 2021 strongly suggests that any long covid from the first year of covid circulation did not exceed levels of post-viral illness that have been seen in previous years.
However, the rise from spring 2021 is highly significant. The timing of this latter rise is coincidental with the rollout of the covid vaccines to the working aged population. Other changes in public health that may have caused this rise are hard to fathom. There are plenty of other signals of vaccine harm. Even the trial data itself shows a higher rate of serious adverse reactions from vaccine (12.5 per 10,000) than any reduction in serious events from covid (2.3 and 6.4 per 10,000 for Pfizer and Moderna respectively). There are numerous other indicators that vaccine harm has been significant. A “long vaccine” phenomenon as a cause of this increasing disability is an important hypothesis that needs to be disproved.
Could people with vaccine injury be misinterpreting their symptoms as long covid?
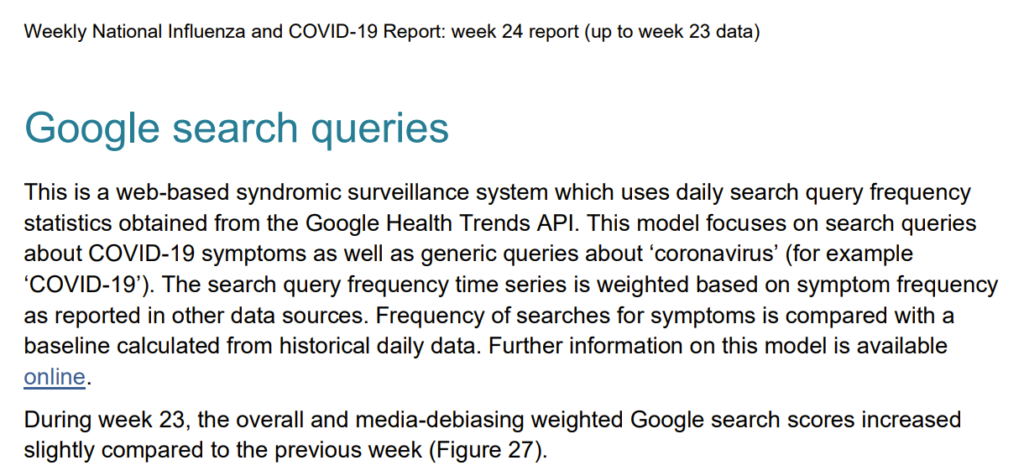
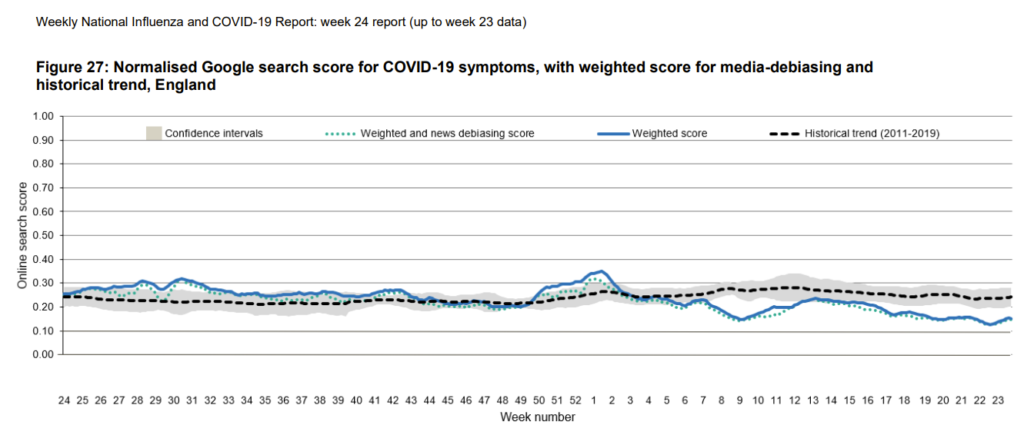
UKHSA (and previously PHE) use Google Search data as a tool for tracking public health. Using this data to track searches for vaccine side effects and long covid in the UK tells an interesting story.
Searches for vaccine side effects began the week before vaccine rollout but then rose sharply in line with first doses (figure 2). A similar effect is seen with the second dose. However, this relationship (between doses and searches for side effects) is not seen for the third dose. People who had the third dose were different in two key ways. Firstly, if there was any reason to be more susceptible to vaccine side effects (eg from genetic make-up, or perhaps underlying health conditions), then those people would likely have rejected any further doses after having had two. Secondly, people having three doses are also more likely to have been especially committed to the vaccine-saviour-narrative that vaccines are harmless and “our only way out”.
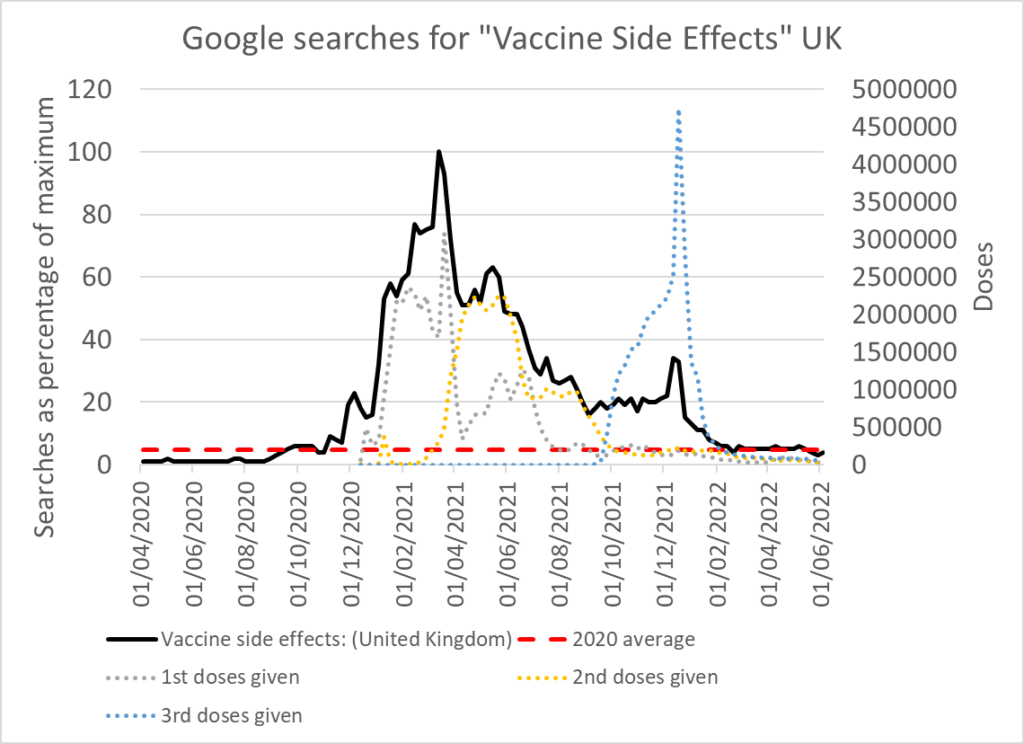
However, what if vaccine side effects are not linked to increased susceptibility, but rather they affect a proportion of those injected with each dose? And what might people committed to the vaccine-saviour-narrative be inclined to blame their side-effects on instead of the vaccine?
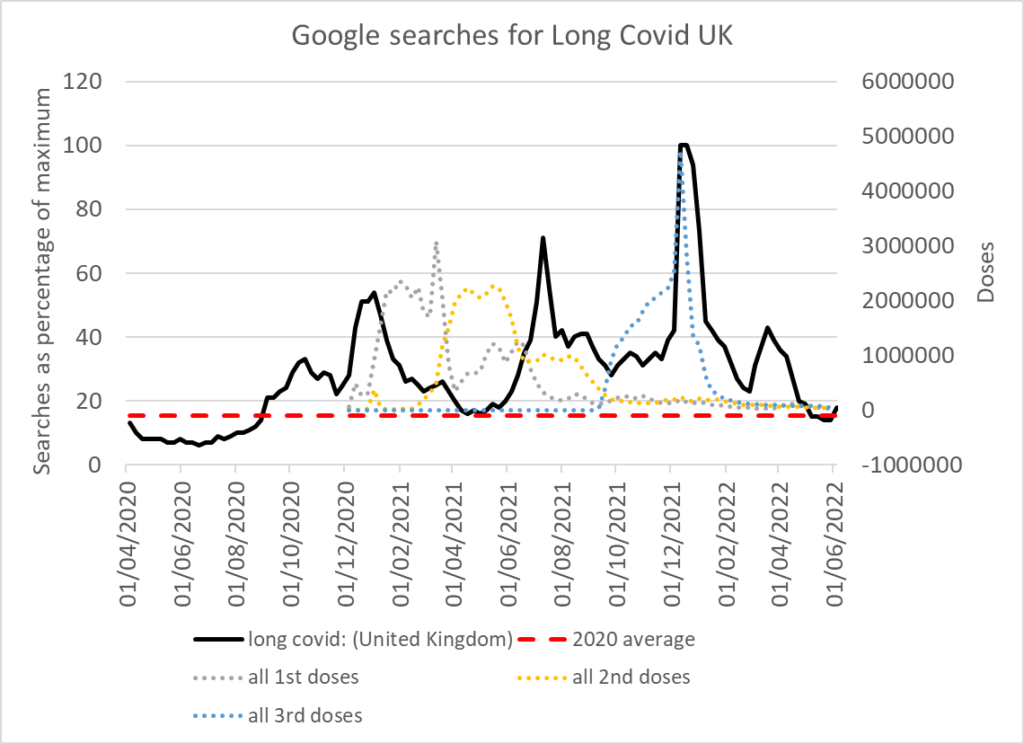
Google searches for long covid rocketed with the rollout of the third vaccine (see figure 3). In fact from 26th December 2021 to 5th March 2022, 95% of the Google searches for long covid could be predicted by the number of third doses given. For the same period, the number of cases explained only 53% of the variation (see figure 4a and 4b).
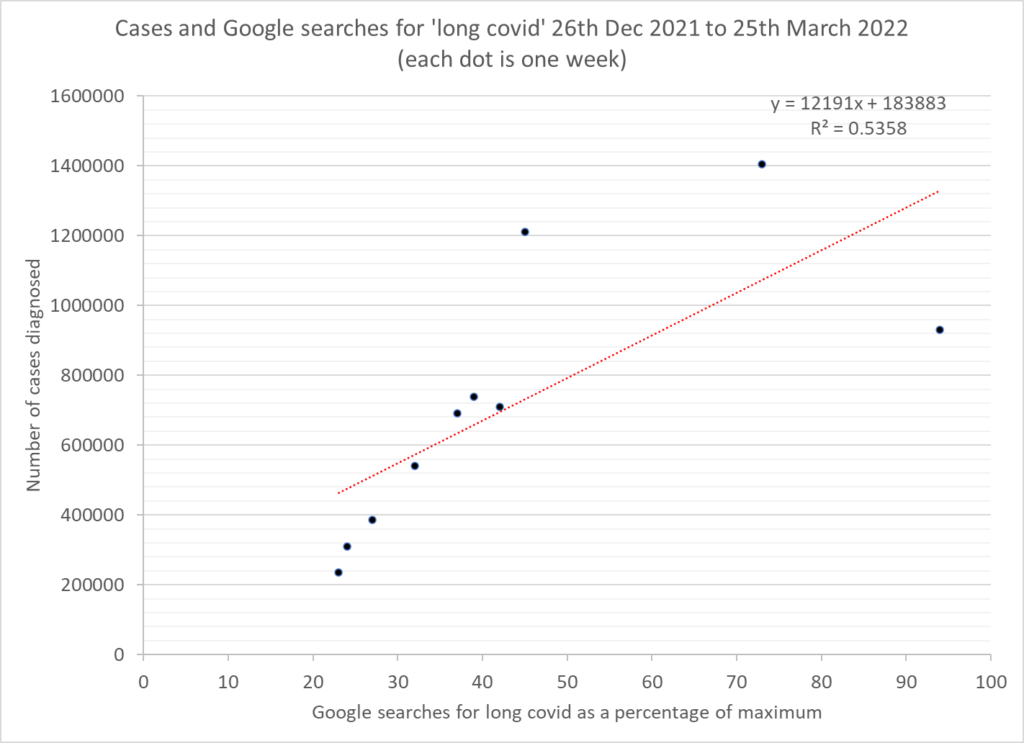
Adding in a one week lag between the number of doses given and the number of searches reduces the correlation to 87% and adding in the same lag for cases reduces it to only 0.1% i.e. there is no correlation. In contrast, for the same period the year before, cases predicted 77% of the Google searches for ‘long covid’ and for March and May 2022 cases again predicted 93% of variation.
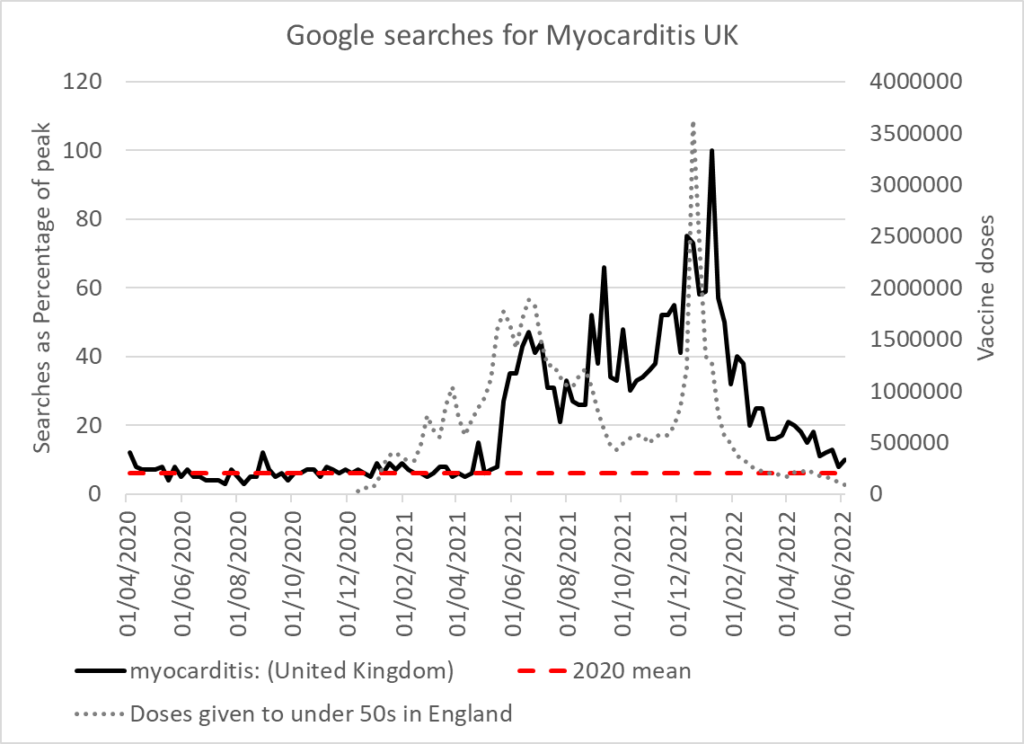
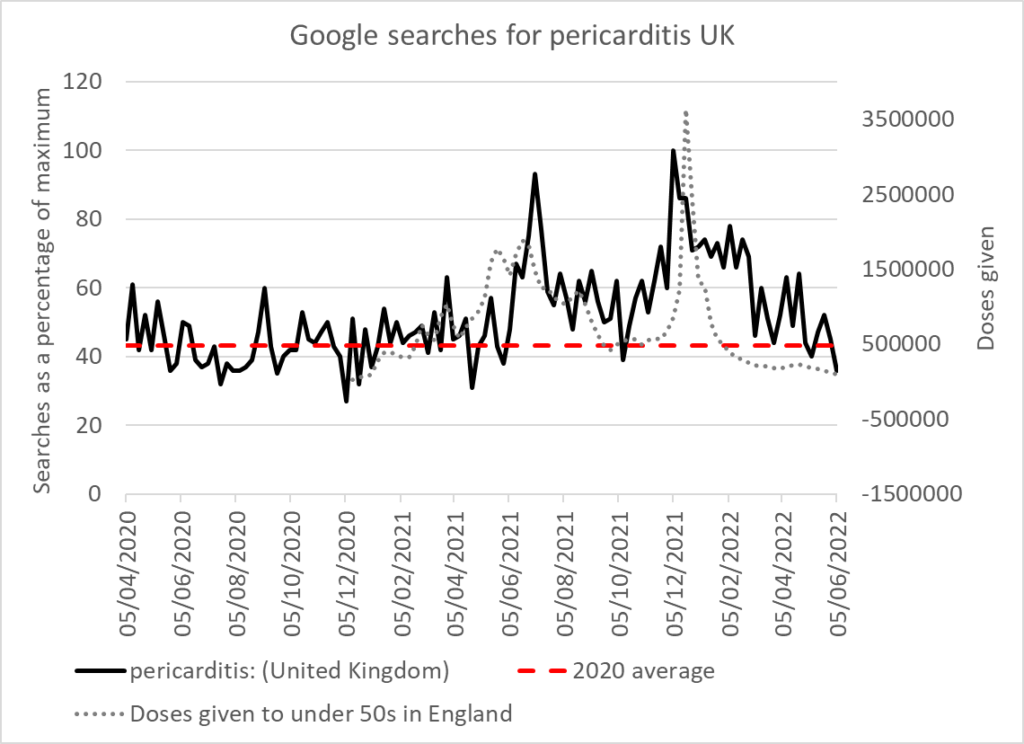
The same methodology can be used to examine searches for particular adverse events. Thankfully, despite increasing discussion around vaccine harm on social media and occasionally mainstream media, these measures have returned to baseline.
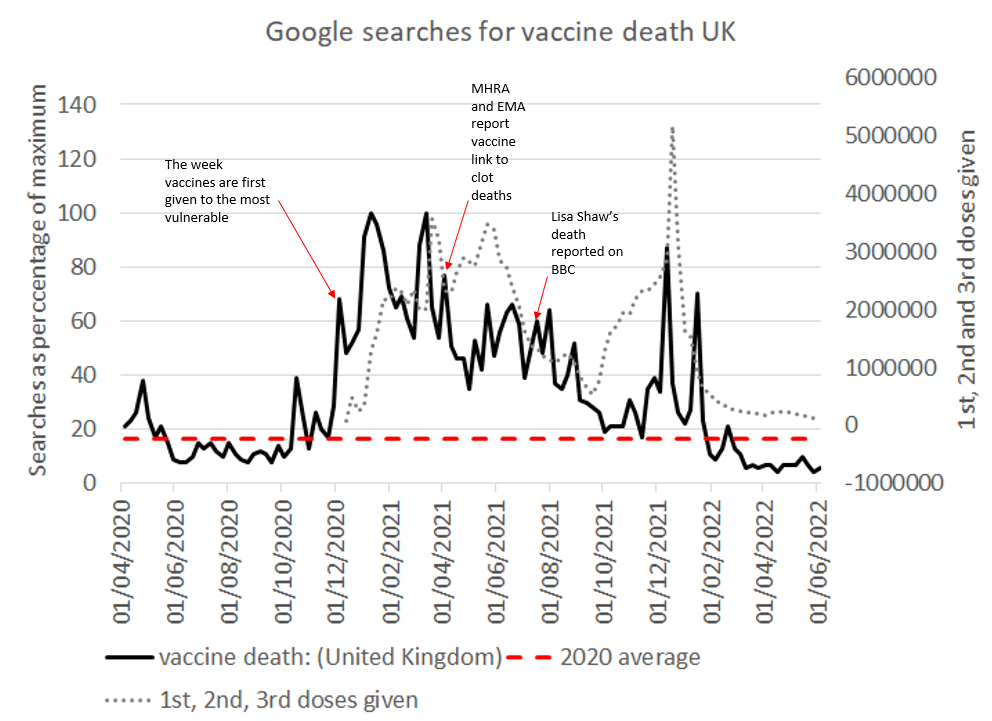
From the above graph, we can see that the initial rise in vaccine death searches occurs the week that vaccination is first rolled out to the most vulnerable.The numbers of doses given halved in September from the summer highs, and in October the vaccine death searches also showed a lull. Doses did not reach the September low again until February and since then search levels have returned to baseline.
It could be argued that the searches for ‘vaccine death’ merely reflect searches carried out after coincidental sudden deaths that happened to occur after vaccination, and these would correlate with vaccine doses given. Similar findings have been found in the USA data. Again, it could be argued that some of the searches will be for coincidental problems but it is telling how sharp the rise is on vaccine rollout compared to the total lack of searches for pre-covid vaccines.
Finding data sources for vaccine harms has been challenging but Google search trends provide interesting information. Although the searches could, at times, relate more to media attention, the fact that announcements on deaths due to vaccination did not increase search levels, and the fact that all search levels have returned to baseline recently, suggests these are a good marker of patient-related searches. Google searches indicate that there has been a strong correlation between vaccine doses and searches for ‘vaccine side effects’ and specific adverse events including ‘myocarditis’, ‘ pericarditis’ and ‘vaccine death’. Thankfully rates for these searches have plummeted in the last few months. Let’s keep it that way.
