
Data massaging from Singapore
Also available on Substack – Come and join the conversation with open comments
The Singapore government has published revised data for 2021 which appears to hide a problem they previously reported of excess cardiac deaths.
Comparison of earlier and later reports
In September 2022, the Singapore government produced a report of deaths since 2020 by cause each year. However, since May 2023, the government website has claimed quite different causes of death. Hundreds of deaths from ischaemic heart disease or hypertensive diseases were reclassified in this period as deaths from pneumonia, external causes and other causes. The percentages by cause are shown in table 1.
| % Deaths 2021 Sep 2022 report | % Deaths 2021 May 2023 website | |
| Cancer | 26.6 | 26.4 |
| Pneumonia | 18.7 | 20.1 |
| Ischaemic Heart Disease | 19.9 | 18.4 |
| Cerebrovascular disease | 6.1 | 6.1 |
| Hypertensive diseases | 3.3 | 2.7 |
| External causes | 2.9 | 3.3 |
| Other heart diseases | 2.2 | 2.3 |
| All other causes | 20.3 | 20.5 |
Table 2 shows these percentages translated into absolute numbers and compares the two, demonstrating that 510 ischaemic heart disease and hypertensive disease deaths had been reclassified.
| % Deaths 2021 Sep 2022 report | Deaths in 2021Sept 2022 report numbers | % Deaths 2021 May 2023 website | Deaths in 2021 May 2023 numbers | Change in deaths from Sep 2022 excess death report to May 2023 | |
| Cancer | 26.6 | 6,462 | 26.4 | 6,413 | -49 |
| Pneumonia | 18.7 | 4,542 | 20.1 | 4,883 | 341 |
| Ischaemic Heart Disease | 19.9 | 4,834 | 18.4 | 4,470 | -364 |
| Cerebrovascular disease | 6.1 | 1,482 | 6.1 | 1,482 | 0 |
| Hypertensive diseases | 3.3 | 802 | 2.7 | 656 | -146 |
| External causes | 2.9 | 704 | 3.3 | 802 | 98 |
| Other heart diseases | 2.2 | 534 | 2.3 | 559 | 25 |
| All other causes | 20.3 | 4,931 | 20.5 | 4,980 | 49 |
| Total | 100.0 | 24,292 | 100.0 | 24,292 | 0 |
What does this mean for the interpretation of excess mortality? Table 3 shows the Sep 2022 excess death report on deaths in 2021 and 2020 and the later 2021 data. The total deaths for each year were here. The excess that was clear in the Sep 2022 report in ischaemic heart disease deaths and all circulatory deaths has been massively reduced.
| Cancer | Pneumonia | Ischaemic heart disease | IHD + hypertensive disease + other heart disease | Cerebrovascular disease | |
| 2020 | 6,307 | 4,146 | 4,521 | 5,558 | 1,323 |
| 2021 original data | 6,462 | 4,542 | 4,834 | 6,170 | 1,482 |
| 2021 latest data | 6,413 | 4,883 | 4,470 | 5,685 | 1,482 |
Comparison with other data from Singapore government
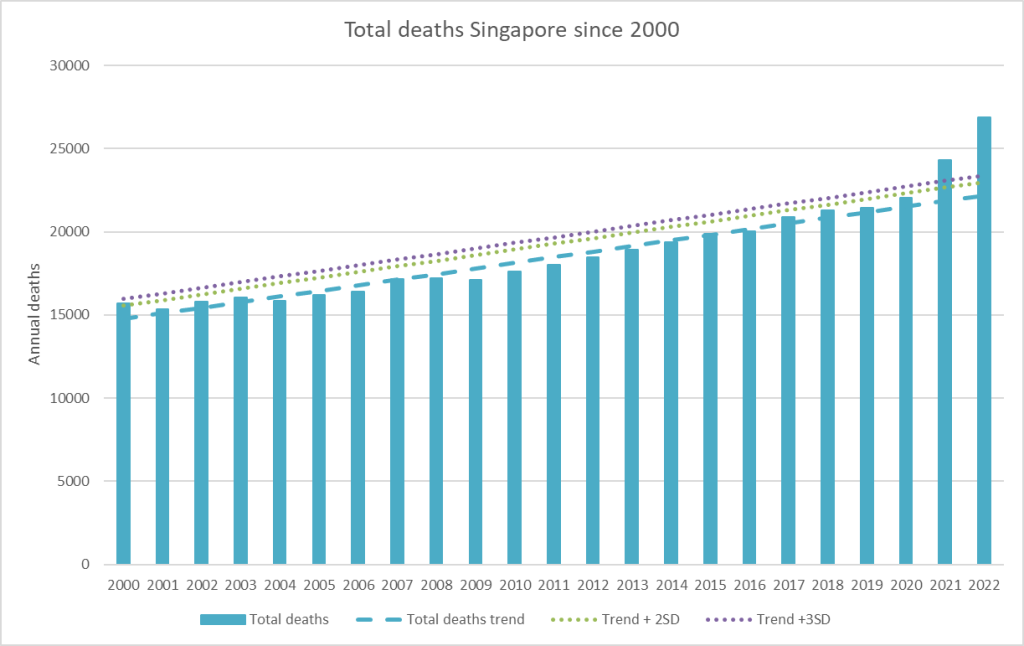
Other data from Singapore continue to show a problem with excess circulatory deaths from 2021. Historic data with slightly different groupings clearly shows an excess mortality in 2021 and 2022 amounting to 7,142 deaths. This is a higher figure than the 6,521 excess seen in monthly data since 2010 up to May 2023, and may be partly due to an ageing population but without death data by age it is hard to account for this. There were officially 1,711 covid deaths by the end of 2022. Interestingly, there were fewer deaths from respiratory causes in 2021. That begs the question as to what was really causing the excess seen in 2021.
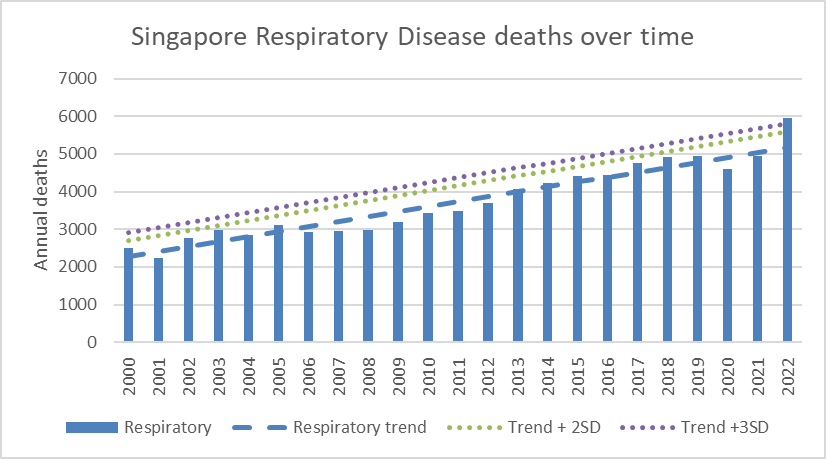
2020 and 2021 saw a deficit of respiratory deaths of 406 deaths. In contrast, 2022 had an excess of 773, more than 3 standard deviations above expected levels. The absence of influenza may well have contributed to the lack of respiratory deaths in 2020 and 2021. The excess in 2022 is fewer than the 883 covid deaths that year.
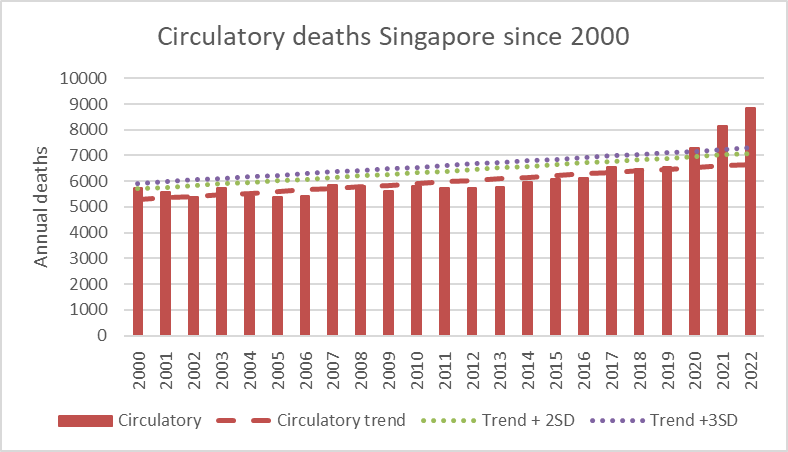
2020 saw a level of circulatory deaths above the trendline, amounting to an excess of 766. It could be that the increased psychological stress of 2020 contributed to the rise in cardiac deaths in 2020 in the absence of covid. For all circulatory deaths there were 1534 excess above trend in 2021 and 2179 excess in 2022.
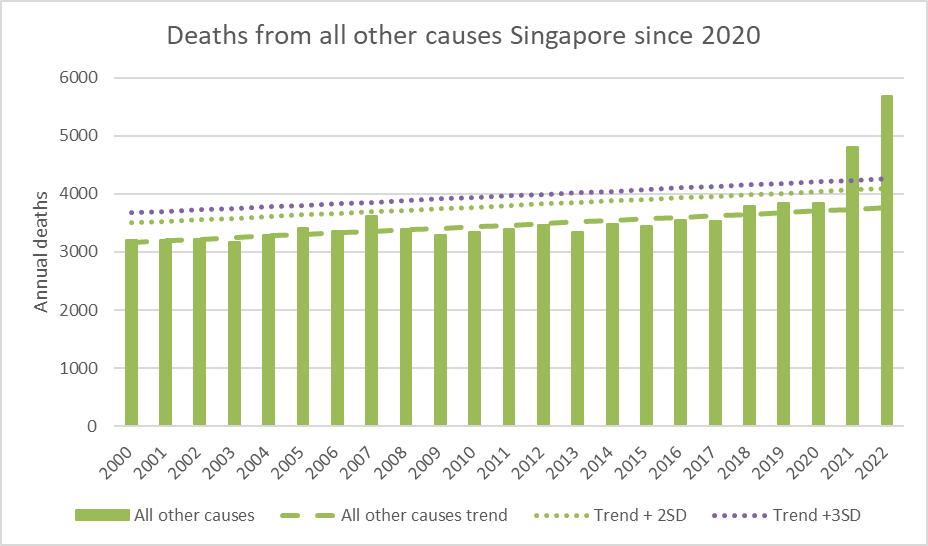
For 2021, there were 1081 excess deaths of other causes and 3001 for 2021 and 2022 together. Cancer deaths were 243 below expected levels in 2021 and 2022.
Overall, there were fewer than expected respiratory deaths and the excess in 2021 was made up of 1534 circulatory deaths and 793 deaths from other causes. There were 799 covid attributed deaths in 2021 but it is not clear which category these fall into. Figure 6 shows the excess or deficit in annual deaths compared with the trend. Covid deaths are included in purple as a comparison to the other causes.
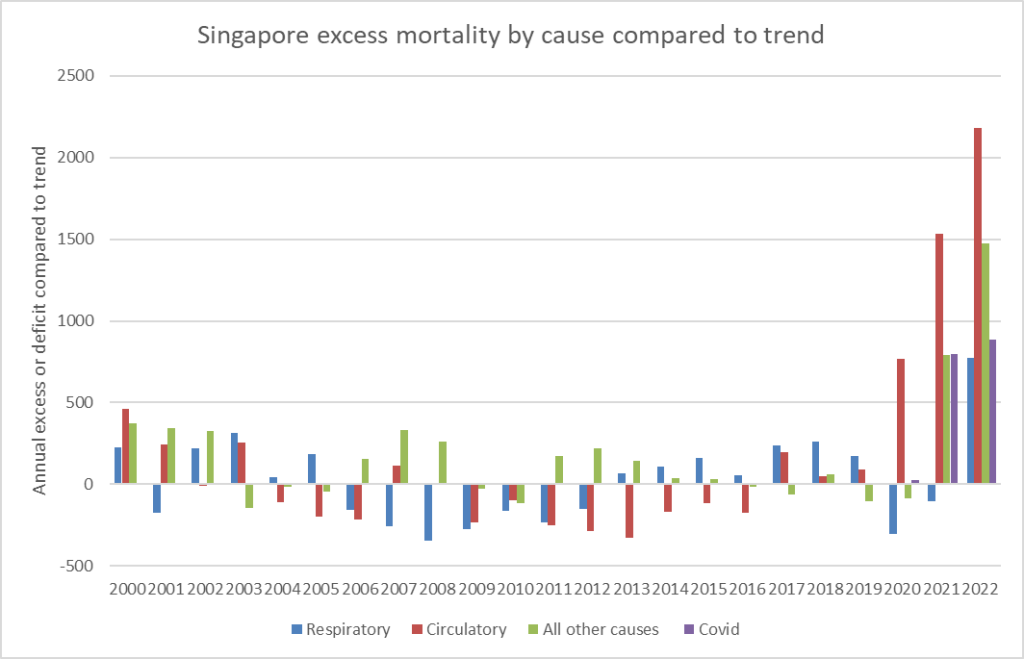
The fact this separate dataset shows an excess of 1534 circulatory deaths with 830 more in 2021 than 2020 shows that the original data from the September report is the more accurate one and that the later changes to this data contradicts more than one of the other official government sources.
