

Summary of recent ONS release on deaths by vaccination status
There are significant problems with bias in the ONS dataset that are covered in two accompanying articles. However, even based on the ONS analysis there are three key points that strongly suggest that 2022 was a bad year for covid vaccines. Due to biases in the data there is an apparent benefit from vaccination in that not only do they (it is claimed) protect against covid death but they also act as an elixir of eternal life, protecting against non-covid death too. In fact the claim made by the ONS is that unvaccinated people were 50% more likely to die of non-covid causes — an extraordinary claim which lacks biological plausibility.
More interesting findings include:
- More than 90% of covid deaths were in the vaccinated
- Age standardised mortality rates in almost all vaccinated groups (except those more than 21 days after a third dose) were higher than for the unvaccinated
- Any sign of benefit from the 4th and 5th doses is elusive
More than 90% of covid deaths were in the vaccinated
For 2022 the total deaths (in the whole population) among those vaccinated were 27,673, whereas there were 3,005 among the unvaccinated. That means more than 90% of deaths with covid happened in the vaccinated. Yes, there will be confounding in that those most likely to die are also those most likely to be vaccinated. It is possible to claim the vaccine reduced death with these numbers. However, having nine times as many deaths in the vaccinated as the unvaccinated is not what would be expected from a vaccine that was sold as providing 100% protection against death.
Age standardised mortality was worse in many vaccinated groups
Even by their own calculations the age standardised mortality rate in 2022 for the unvaccinated is lower than those who took one dose, two doses or were within 21 days of a third dose. The ONS claim a lower mortality rate for those more than 21 days after the third dose (see figure 1). The ONS has claimed a healthy vaccinee effect, “where people who are ill (either due to COVID-19 or another relevant illness) are likely to delay vaccination. Therefore, the people who have been recently vaccinated are, in the short term, in better health than the general population”.
Of course it was also true that those who were most at risk of dying were prioritised for vaccination, and in the same ONS report they do indeed also claim there was “prioritisation of clinically extremely vulnerable and people with underlying health conditions.” If those on their deathbed were prioritised for vaccination then why is the mortality rate in the recently vaccinated always so low? If, on the other hand, those on their deathbed rejected the next dose resulting in a higher mortality rate in those with fewer than maximal doses, then why is that effect not short-lived? It is extraordinary that two years later those same people are still dying at higher rates.
There is moreover a very odd lack of seasonality to the mortality rate, particularly in those who have had three doses more than 21 days prior.
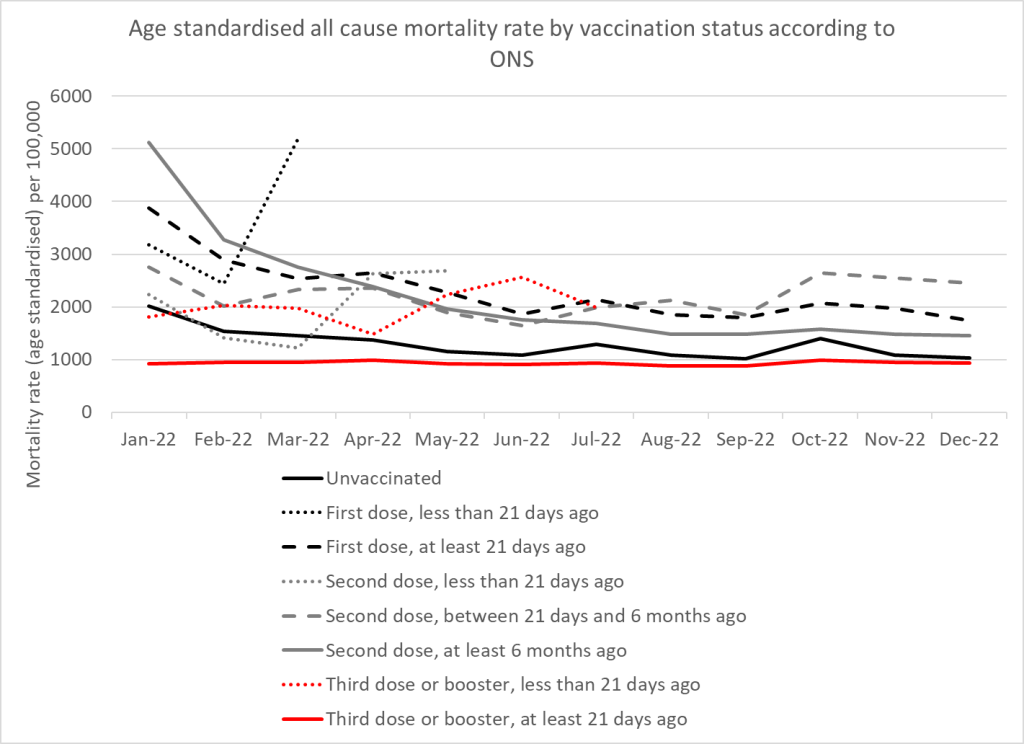
Figure 1: ONS calculations of age standardised mortality rates by vaccination status
Benefit of 4th and 5th doses is elusive
No protective effect against covid deaths can be seen in 2022 for 18-39 year olds and any effect in older age groups is negligible, with no apparent improvement with the spring 2022 and autumn 2022 booster campaigns (4th and 5th doses).
Joel Smalley demonstrated the bias in the ONS sample by showing deaths in the vaccinated were higher than the proportion of the whole population who had been vaccinated.
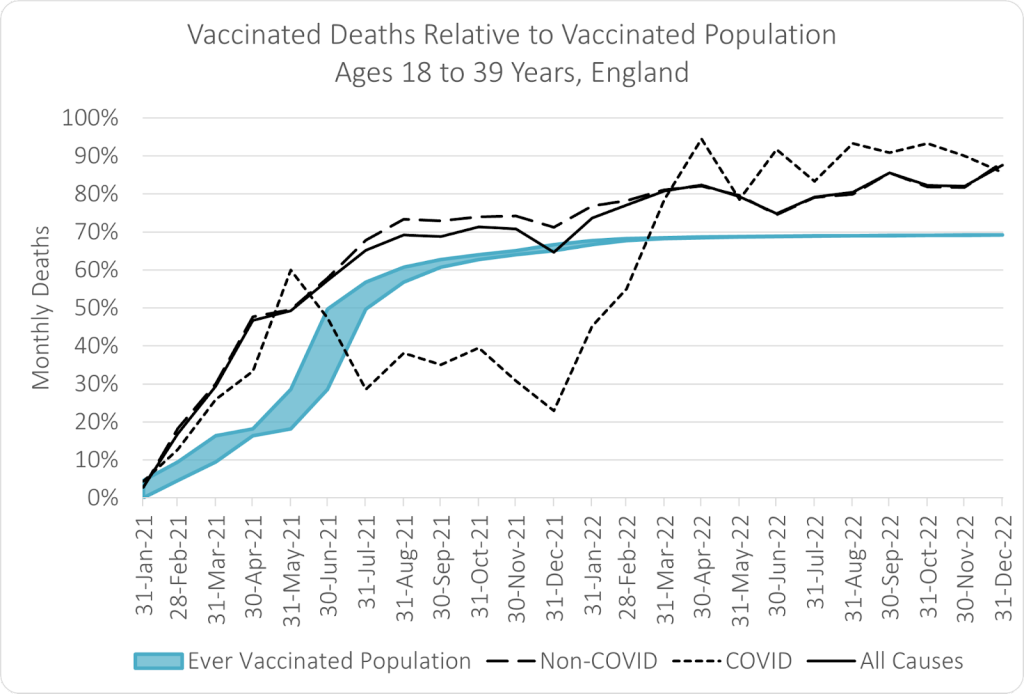
Figure 2: Percentage of whole population who were vaccinated (blue line) compared to percentage of deaths that were vaccinated for 18-39 year olds
The ONS do not claim to have included all the population, so the graph above has been recreated below for the population they have included. Unhelpfully the ONS have recorded all entries where there were fewer than three deaths as “<3.” Because subcategories of vaccination status e.g. “within 21 days of second dose” are very small this affects much of the data and they provide no “ever vaccinated” value by age. To make up for this deficit of information it is possible to subtract the unvaccinated deaths from the total deaths to give vaccinated deaths, and to subtract the non-covid deaths from the all cause deaths to give covid deaths. The graph below uses two different approaches and achieves different results.
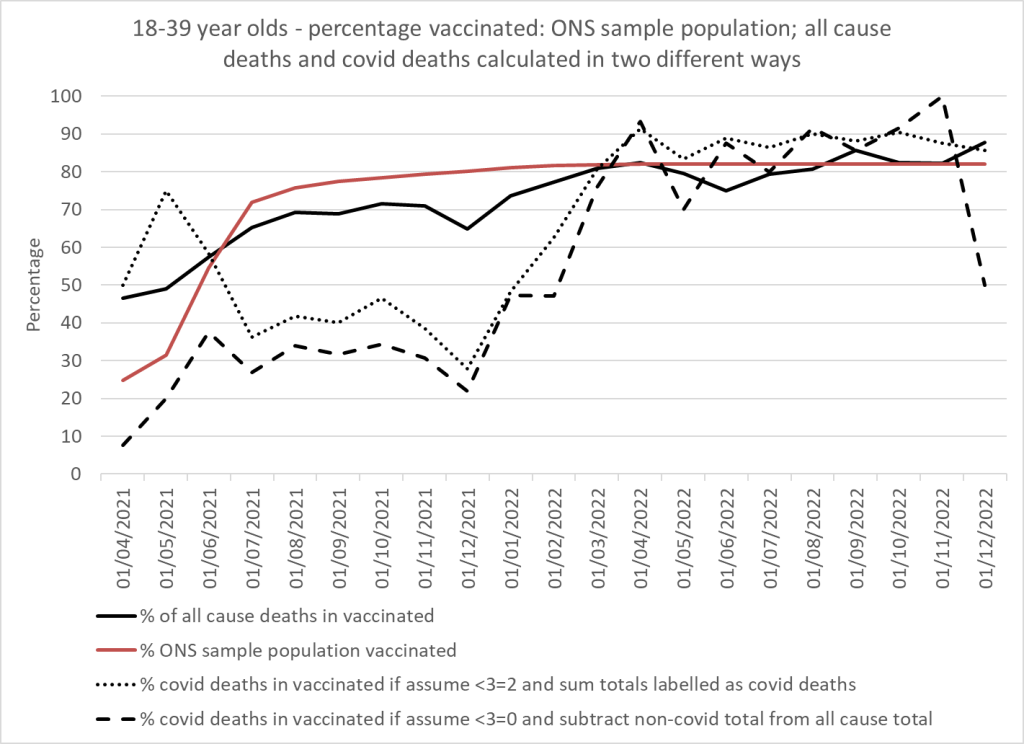
Figure 3: Data from ONS sample of 18-39 year olds showing the percentage of the population who were vaccinated (red line), percentage of all cause deaths that were vaccinated (solid black line) and the percentage of covid deaths that were vaccinated calculated with different methods (dotted and dashed black lines)
The covid trajectory shows three distinct periods. Prior to rollout in the general population the vaccine was targeted to the population most at risk of dying. However, the proportion of with covid deaths in the vaccinated in that period was, worryingly, notably higher than the proportion of overall deaths that were in the vaccinated. There is then a period with more comprehensive rollout during the Delta wave when the relationship reverses. This could have occurred due to one or more of these factors:
- a protective effect from vaccination against death
- a bias whereby those most at risk of dying with covid e.g. lower socioeconomic groups and certain ethnic minority groups were the least likely to be vaccinated
- a bias where dying unvaccinated people were more likely to be tested than dying vaccinated people
With the arrival of Omicron the relationship reverses again. From spring 2022 the total covid deaths each month in this population fell to 15 or lower and therefore making deductions about the percentage that were vaccinated will have wide error margins. Nevertheless there was a significant reversal with the arrival of Omicron. This could have occurred due to one or more of these factors:
- vaccination provides no protection
- a bias in which a higher proportion of the unvaccinated population are protected by natural immunity
- a bias in which those most at risk of covid death are all vaccinated
There is no way of interpreting the data in 2022 to suggest that vaccination is having a protective effect against death with covid for the 18-39 age group.
For older age groups the benefit against covid deaths become negligible in 2022. If you squint you might convince yourself that there was a dip with the 4th and 5th dose campaigns but the protection was nothing like what seemed to be the case with Delta.
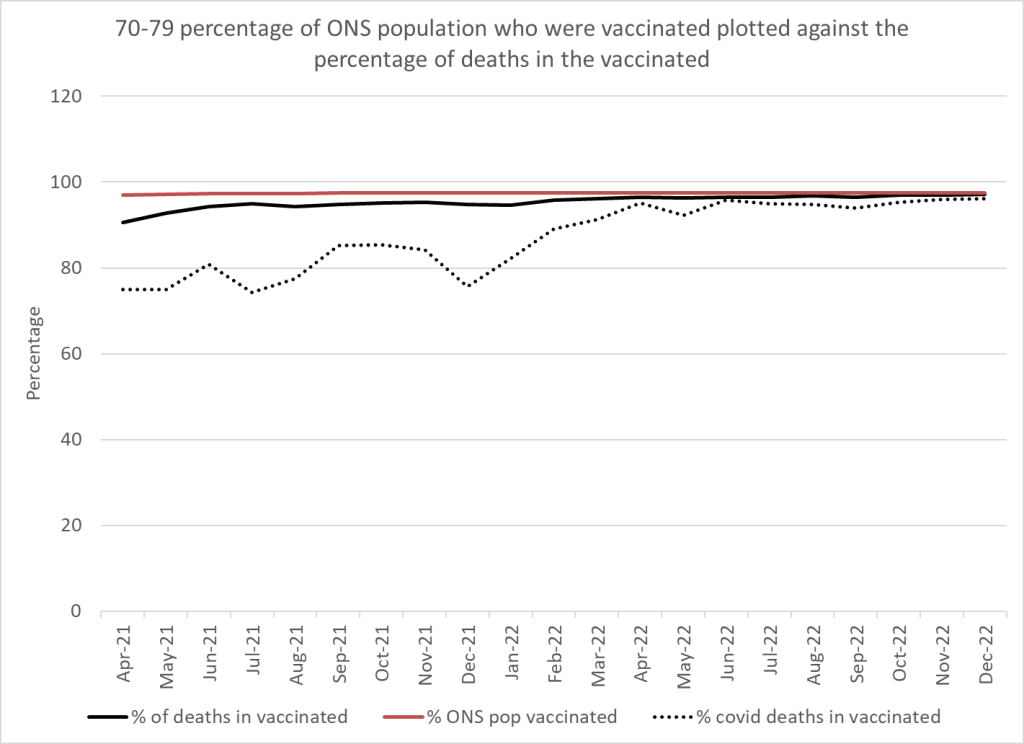
Figure 4: Data from ONS sample of 70-79 year olds showing the percentage of the population who were vaccinated (red line), percentage of all cause deaths that were vaccinated (solid black line) and the percentage of covid deaths that were vaccinated (dotted black line)
Conclusion
Even ignoring the various sources of bias within the ONS sample data a superficial look shows that any apparent benefit that was deduced from the 2021 data had all but disappeared in 2022.
