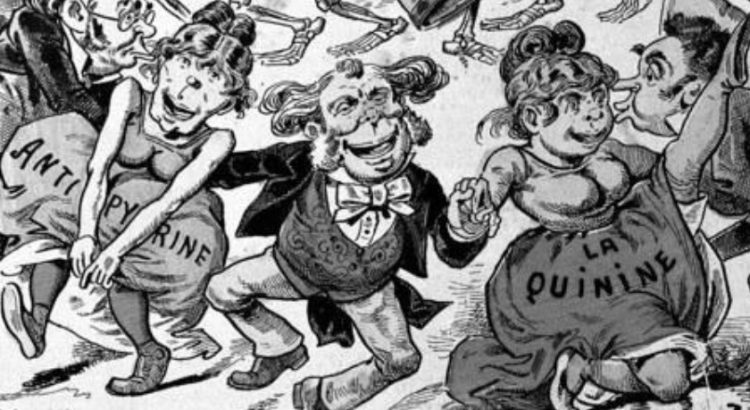
Today historians debate whether Russian influenza (1889-1891) was caused by influenza virus or coronavirus. That is the wrong question. The more important question is what contemporary observers were saying about the medicines.
Mortality data
The great disruption
Six years on from the first lockdown, this article looks at excess deaths from just one condition, gall stones, and considers the likelihood of a much larger and still unacknowledged catastrophe of indirect harm.

Inconvenient Deaths
How the return to baseline reveals the hidden excess Dr Clare Craig FRCPath The 2025 death registration data for England is now available. It offers a chance to revisit a benchmark: the ONS 2018 population and mortality projections, published before the pandemic, before lockdown, and before any changes in methodology. According to those projections, deaths […]

Comorbidity and death from or following Covid-19 in the Pfizer/BNT162b2 trial
A further analysis of the deaths in the Pfizer/BioNTech Covid-19 vaccine trial – obesity stood out as the greatest danger in the comorbidities of the trial participants who died of or following Covid-19 reflect the metabolic health crisis affecting much of the world.
A unique and powerful opportunity to start tackling the metabolic health crisis and make long term health improvements in the UK was wasted.
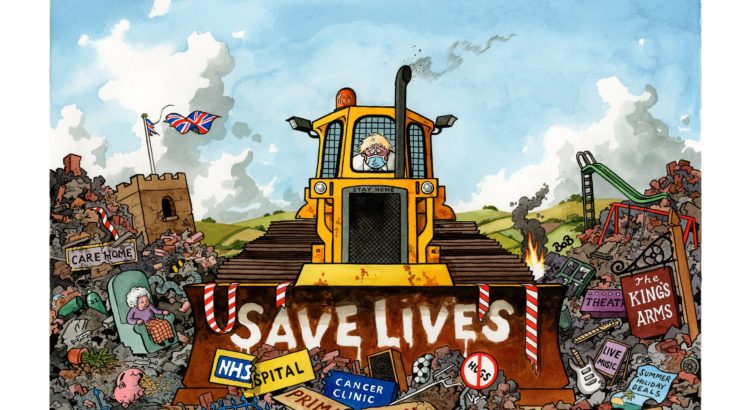
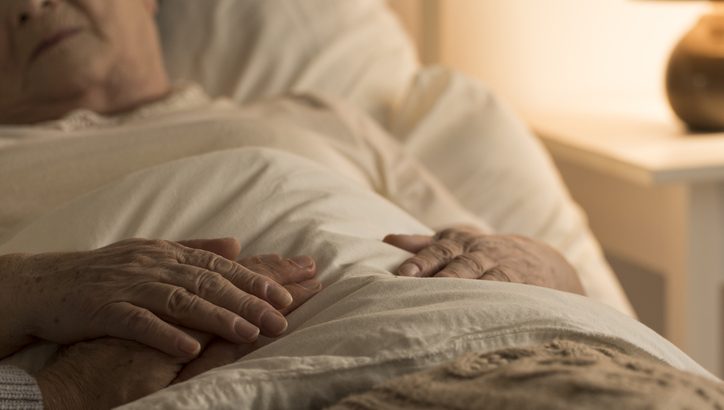
Killing not Care
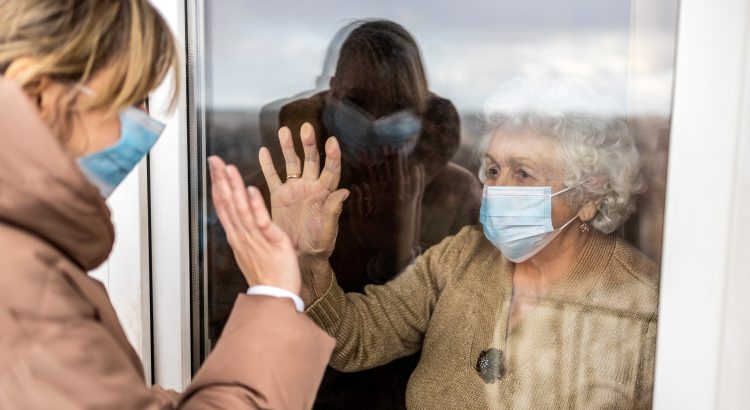
Module 6 of the UK C-19 Inquiry has just completed taking evidence, and much of it has been very harrowing. The overwhelming impression is of numerous unnecessary deaths, not from covid-19 but from loneliness, neglect, dehydration, denial of access to basic medical care, and most seriously the blanket application of DNAR notices across care homes for the elderly and even for young adult with disabilities, often without the patient’s consent or the family’s knowledge. Read this and tell me that the Terminally Ill (End of Life) Bill will be remotely equipped to prevent abuse and coercion.
Pandemic or Scamdemic?
Pandemic or Scamdemic? Was there ever a virus at all – wet meat market or lab-leaked or just mislabelled flu or none of the above? And does it matter if we are all agreed that it was the response that killed?

What really caused covid deaths?
There is something rather odd about the fatality rate for covid in hospitals. NHS England have published data on covid deaths and hospitalisations (which includes both admissions and diagnoses of inpatients).

Have ONS admitted to problems with their data?
There have been numerous papers and much public health data where the vaccinated have been described as unvaccinated for two or three weeks which causes a double bias in the data. The higher rate of covid in the first few weeks after injection amplifies the problem.
The new rites of passage
It has become almost impossible to die in this country without first being injected. No longer is the priest by the bedside reading last rites, it’s the vaccinator.
Covid-19 Response and Excess Deaths
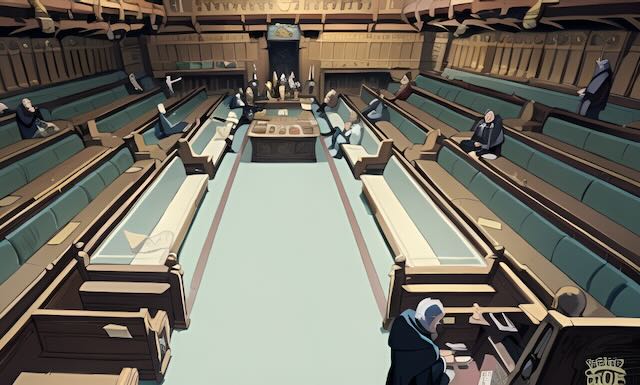
On 18th April, Andrew Bridgen finally secured a full length debate on this vexed topic, the original text of which is available here. Full length in theory, but shortly before the debate was due to begin, the deputy Speaker told him he only had 15 minutes instead of the 30 minutes he had prepared. After a complaint to the Speaker’s office the compromise was 20 minutes.
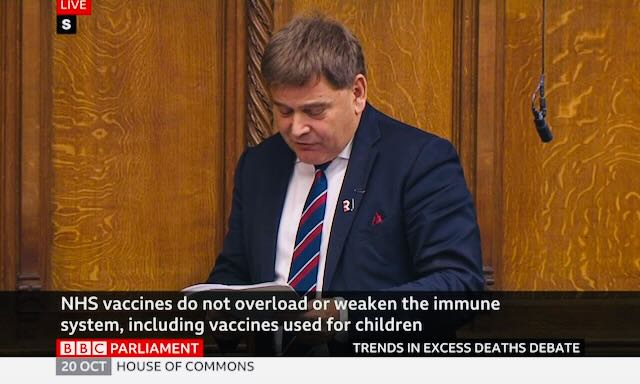
Covid-19: Response and Excess Deaths
You can watch the entire debate on Parliamentary TV archives, Timestamp: 14:33:25. Click on this Timestamp from the pull down menu on the righthand side of the web page.

Too many deaths are to be expected
Mathematical modelling has a role to play in predicting deaths but as with all modelling it needs to be used very carefully. We have seen modellers who make the assumption that everyone was susceptible to covid then producing dramatic graphs that show everyone would catch it. We’ve also seen modellers who assumed masks worked then producing dramatic graphs of how they could minimise covid. Of all modelling crimes, putting your conclusion into your assumptions is surely the worst.
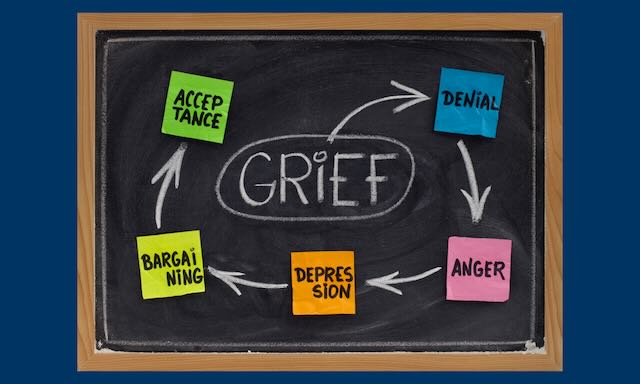
Trying to bargain away the excess deaths problem
Politicians fancied themselves as heroes in 2020. They were saving lives. Having played doctor with the population they are now being shown the fallout and it is not pretty. They are working through the stages of grief.

Death notices tell a different Covid story
Members of HART were struck by this analysis from Dr Simon and have published it here with his permission: It is a very common practice to write a death notice in New Zealand after a loved one has passed away. This practice is so common in New Zealand that frequently more death notices get published through Legacy.com than the number of deceased, as some people publish more than one death notice for the family member that passed away.
Examining the ONS all-cause mortality data
It is not necessary to have a degree in statistics to understand that something is very amiss with public data reporting, with lack of transparency being the most egregious issue. The taxpayer funds the very existence of the ONS. We should have access to the information that we are paying to be collected.

Excess mortality in England post Covid-19 pandemic
Lancet article co-authored by Sarah
Caul, MBE, finally acknowledges that excess deaths are a problem but is recommending a timely granular analysis rather than doing one.

How not to handle a data leak
A New Zealand health ministry employee was arrested for leaking records on vaccination status and death from the government database. He faces up to seven years in prison. The government admits that there has been no privacy breach as the data was anonymised yet, by arresting him they have confirmed the veracity of the data and implied they do not want the public seeing it.
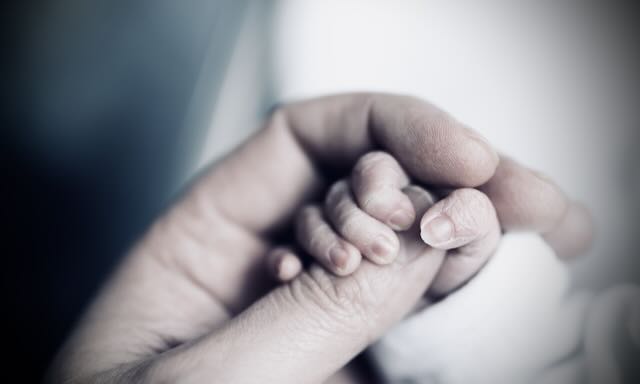
Deaths of Scottish babies
Public Health Scotland demonstrated a significant increase in neonatal deaths (in the first month of life) in 2021 but refused to investigate whether it was related to the vaccine because such an analysis “whilst being uninformative for public health decision making, had the potential to be used to harm vaccine confidence”.
