Bias and why observational studies can’t answer the lives saved question
Dr David White
Part 1. The Healthy vaccinee effect.
The UK Covid-19 Inquiry Module 4 report (Vaccines and Therapeutics) was published in April and much has been written about it by HART and others. One major criticism of Baroness Hallett and her team has been their lack of critical approach to the information given to them by government, regulatory bodies and the pharmaceutical industry regarding the safety and efficacy of the vaccines.
The clearest example of this was in her press briefing and the executive summary which picked on the largest published estimate of lives saved, namely 475,000 in England and Scotland. Against this huge apparent success, picked up and amplified by all the mainstream media, lay the “tragic” but “rare” or indeed “extremely rare” vaccine injuries, sacrificed for the ‘greater good’.
So what is the basis of this claim and can it all be explained by the ‘healthy vaccinee effect’?
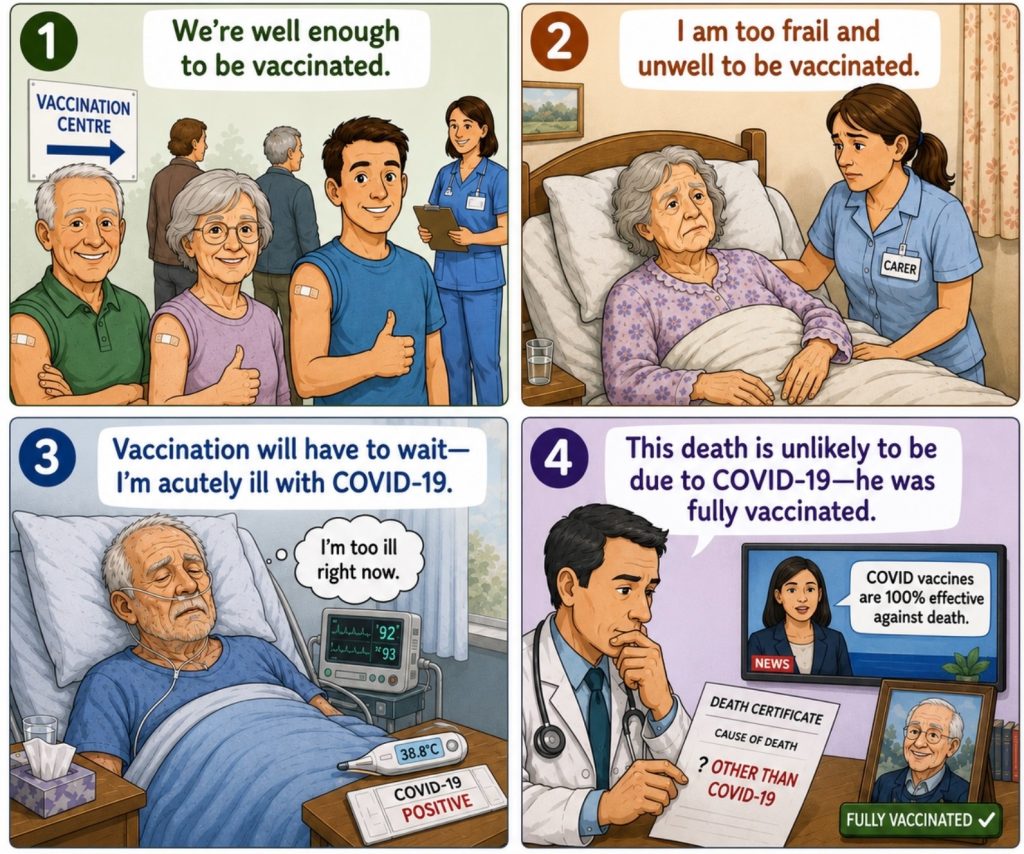
Figure 1. Four scenarios that may inflate observational estimates of vaccine effectiveness against death. The first 3 illustrate the healthy vaccinee effect — those well enough to be vaccinated are less likely to die of pneumonia or any cause in the near future.
- The healthy vaccinee effect (HVE), a form of selection bias, is a recognised source of bias in observational data.
- HVE biased studies report implausible findings – reductions in non-target deaths in the vaccinated and very early benefit, both before the target virus is circulating and before a biological effect is plausible.
- The Inquiry’s estimate is underpinned by vaccine effectiveness estimates from observational studies. Two provided enough data to allow residual bias to be identified and corrected to produce a bias-adjusted estimate.
- If non-Covid-19 deaths are used as a negative control outcome to correct residual bias in these 2 observational studies, apparent vaccine effectiveness against Covid-19 death reduces from more than 80% to about 22.7% and 41.6% respectively.
- It is likely that even the corrected VEs are still confounded by misclassification bias (scenario 4 above) and a novel form of bias – acute disease-specific healthy vaccinee bias, caused by vaccinating during outbreaks (scenario 3). Here infection status determines both vaccination status and outcome.
- Both of these biases have a plausible mechanism with the potential power to account for all of the benefit remaining after correction using a negative control.
- Due to their susceptibility to bias, observational studies cannot be used with any confidence to estimate that any lives were saved by vaccination.
The Inquiry’s estimate is taken from a modelling paper published in The Lancet Respiratory Medicine. The module 4 report states:
‘Analysis of data from the World Health Organization estimated that, by March 2023, the lives of about 475,000 people aged 25 years or older had been saved as a result of Covid-19 vaccinations in England and Scotland.’
Figure 2. What the estimate says would have happened without vaccines.
The red line in figure 2 is a simplified visualisation showing the magnitude of the counterfactual estimate relative to observed deaths. It is not reproduced from the original Lancet publication. The Inquiry’s estimate has been added in red to an Our World in Data graph of cumulative Covid-19 deaths in the UK.
The randomised trials were not powered (not enough participants or time) to demonstrate an effect on mortality. Instead, the modellers used 24 mostly observational studies with their built in susceptibility to bias, to estimate vaccine effectiveness (VE) against death. Their estimate of the number of lives saved is largely based on their estimates of VE – a model based on a model. This review looks at healthy vaccinee bias, both frailty-related and acute infection specific, together with bias in attributing cause of death whether by death certification or PCR testing, and which of these biases in observational data can be corrected.
What is the healthy vaccinee effect (HVE)?
Descriptions include – those that receive vaccination being in better health, healthier, more health conscious, or when those who are unwell delay vaccination.
For frailty-related HVE to bias an observational study on mortality, two things need to happen. Firstly the frail and already near to death must be more likely to die from the infection being vaccinated against, than the well. Secondly either more than half of the well must be in the vaccinated group or more than half of the frail must be in the not-vaccinated group. In the hypothetical outbreak of virus X shown in figure 3, the frail are evenly distributed but the well are more likely to be vaccinated than unvaccinated.
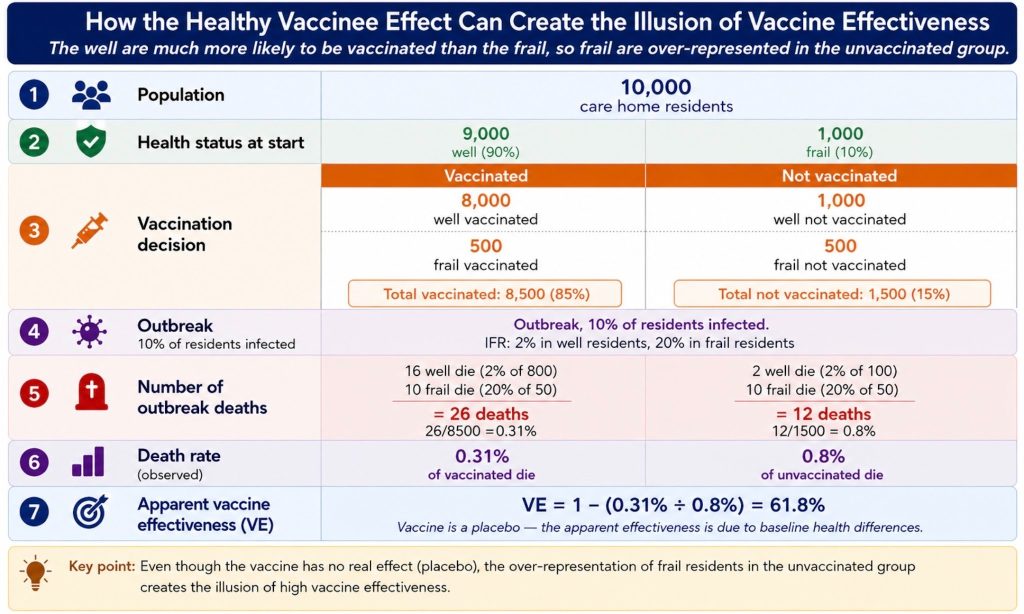
Figure 3. Simplified example for illustration showing how the HVE might work in care homes when the majority (89%) of the well are vaccinated but only 50% of the frail. The hypothetical outbreak is caused by virus X, with an infection fatality rate (IFR) of 2% in the well and 20% in the frail. 10% of the population are assumed frail, and overall vaccination rate is 85%. The vaccine is an inactive placebo. Other assumptions could lead to a higher apparent VE. If ¾ of the frail remained unvaccinated in the example, apparent VE would be 74%.
The same hypothetical virus X infection, care home population, and no true vaccine effect, is also considered in figure 4. Both uptake proportions now vary independently: columns = % of well residents vaccinated, rows = % of frail residents vaccinated.
If the rate of vaccination in the well is higher than in the frail, apparent VE is positive, if it is lower, VE is negative. If the rates are the same apparent VE =0%. Apparent VE increases as the percentage of well that are vaccinated increases and the percentage of frail that are vaccinated decreases.
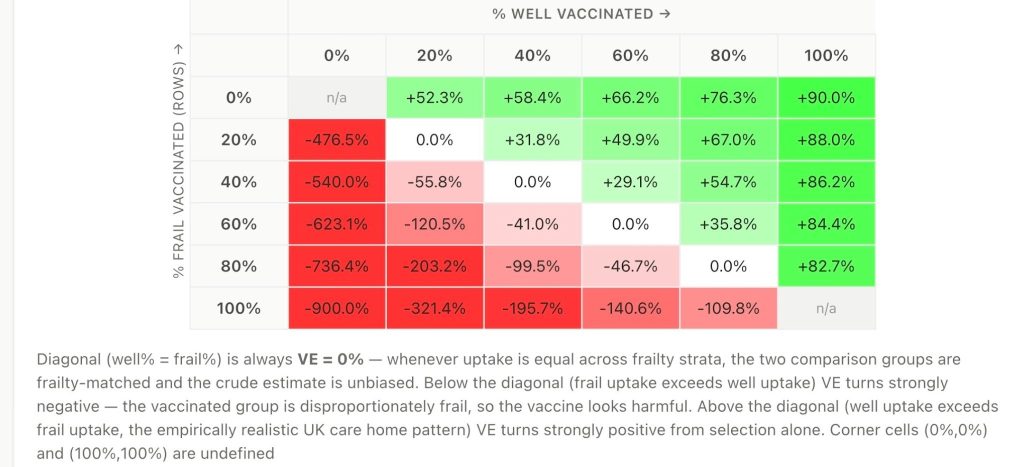
Figure 4. Apparent VE% as a joint function of vaccination uptake in the well and frail. Hypothetical virus X outbreak in care home population: 10% frail with IFR 20%, 90% well with IFR 2%. Vaccine is an inactive placebo.
Functional limitations in the elderly and frailty are not confined to care homes. In England and Wales in 2011 3.2% of those aged 65 years and over were living in a care home. For those aged 85 and over the figure was 13.7%. The majority of elderly people live in their own homes, some with considerable support especially in the last years of life. This may be provided by family, local authority or independent sector home care companies. Local authorities spend ⅓ of their budget for older adult care on community based care and ⅔ on care homes. Although I have used care homes in the example, a similar argument applies to elderly people living in their own homes, the main differences being the proportion of frail in the population living in their own homes is likely to be lower, together with variations in testing and vaccination route.
Why a healthy vaccinee effect would be expected
The weeks preceding death due to old age frailty are often characterised by declining mobility, poor appetite, reluctance to drink, increasing dependence, taking to bed and periods of confusion or agitation. If offered a vaccination during this time it would not be surprising if it was declined. If living in their own home they likely wouldn’t want or be able to attend a vaccination centre. If living in a care home – family, carers, nurses or doctors may advise deferral of the vaccination. As health worsens and they are confined to bed, they may develop terminal pneumonia (whether initiated by SARS-CoV-2 or any other virus circulating at the time).
The Green Book states: ‘If an individual is acutely unwell (for example with a fever above 38.5 C), immunisation may be postponed until they have fully recovered. This is to avoid wrongly attributing any new symptom or the progression of symptoms to the vaccine.’
The problem is that in an observational study, the control group, or reference group, is not randomly allocated (which is needed if confounding is to be minimised) but is made up of individuals who choose not to be vaccinated or are advised to defer their vaccines, and this includes those at the end of life who are too sick to be vaccinated and most likely to die of pneumonia in the near future. Vaccination protocols that recommend deferral during acute illness inevitably create the potential for healthy vaccinee bias in observational comparisons.
The HVE and counterfactual modelling
How many lives did the placebo vaccine save in the care home outbreak in figure 3?
We can use the unvaccinated as a reference group to estimate counterfactual deaths in the vaccinated residents as stipulated in the Lancet modelling paper. Because 0.8% (12 out of 1500) of the unvaccinated residents died of infection with virus X, the number of counterfactual virus X deaths that would be predicted to have occurred in the vaccinated residents without vaccination is also 0.8% so 68 out of 8500 residents. As only 26 died in the scenario, 42 lives could be estimated to have been saved by the placebo vaccine.
Or we could use the formula
Estimated lives saved = Number vaccinated x death rate in unvaccinated x VE
or estimated lives saved = Nv x Ru x VE = 8500×0.008×0.618 = 42
The HVE predicts that placebo vaccines with no biological effect against Covid-19 death would show the following characteristics in observational studies:
- one dose to appear surprisingly effective at preventing death not only from Covid-19 but from all causes;
- fast onset of protection as soon as the frail unvaccinated start dying of pneumonia but rapid waning as the frail unvaccinated die out;
- different vaccines would appear to be equally effective;
- the greater the number of healthy people taking them – the more effective the vaccine would appear to be;
- boosting would appear to be recurrently effective until about half of the healthy declined them.
The HVE in influenza vaccination
In influenza vaccine observational studies: vaccination was found to prevent 50% of all deaths when only 5% of deaths were related to influenza in an average winter; the largest difference in mortality occurred before the influenza season; the HVE is strongest immediately after vaccination and declines with time; those with more functional limitations such as requiring assistance for bathing were less likely to be vaccinated; and adjustment for diagnosis code variables did not control for this bias.
The HVE in Covid vaccination
There are numerous studies where healthy vaccinee effect could account for apparent Covid vaccine effectiveness:
1. An early analysis by Public Health England reported a reduction in Covid-19 mortality within the first 14 days after vaccination (HR 0.74), a period during which a biological effect is unlikely to explain the observation.
2. A study from Qatar specifically designed to assess the healthy vaccinee effect reported substantially lower non-Covid mortality among vaccinated individuals, with adjusted hazard ratios as low as 0.35 (95% CI 0.27–0.46) in the first six months following two doses, consistent with a pronounced healthy vaccinee effect.
3. Humphreys et al. found: ‘vaccinated individuals had a reduced risk of death unrelated to COVID-19 compared to the unvaccinated population. Among those aged 65–79 years, aHR’ … for non-Covid-19 mortality … ‘ranged from 0.36 to 0.58, and from 0.35 to 0.70 among those aged ≥ 80 years-old.’
4. The ONS addressed the issue of bias in 2023:
‘As coronavirus (COVID-19) vaccination should not provide protection against non-COVID-19 mortality, we can use non-COVID-19 mortality as a control outcome to assess the amount of confounding left in our model’ ……also ….’even when including all adjustments for confounding factors, we observe a reduction in risk of non-COVID-19 death for vaccinated groups compared with the unvaccinated population.’
Even after full adjustment of its observational data, the ONS reported a reduction in non-Covid-19 mortality in the vaccinated which reached almost 50% after dose 3. with the apparent protection continuing beyond 3 months post dose.
5. The Lancet modelling paper quoted by the Inquiry based its estimate largely on vaccine effectiveness estimates derived from 24 mainly observational studies (about 5 were test-negative studies), leading it to reach VE estimates of 67-95% . The range represents different doses and variants. Two of the papers, Hulme et al. and Kaura et al. both from England, reported on both Covid-19 and non-Covid-19 or all-cause deaths. Each shows the same order of magnitude (over 80%) reduction in risk of death from non-Covid-19 causes as from Covid-19, a feature consistent with significant HVE bias.
6. Effectiveness of BNT162b2 booster doses in England: an observational study in OpenSAFELY-TPP Hulme et al.
Among 4,352,417 BNT162b2 booster recipients matched with unboosted controls, estimated effectiveness of a booster dose compared with two doses only was …. 88.5% (85.0-91.1) for COVID-19 death, and 80.3% (79.0-81.5) for non-COVID-19 death.
Two time periods were analysed and show a VE against Covid-19 death of 81% (days 1-28) and 93% (days 29-70). Such a high degree of genuine biological protection would not be expected during the earlier time period, and again supports that it is predominantly HVE bias that is being measured not VE.
In this study, features suggestive of HVE bias are apparent even though those in care or nursing homes, those receiving end of life care and those medically housebound were excluded. The study used national death registry records from the Office for National Statistics (ONS), which is based on data from death certificates.
7. Kaura et al. collected data from North-West London, in individuals aged 16 and older, and looked at a matched cohort on days 14-84 after the first dose. A Covid-19 death was defined as a death within 28 days of a positive PCR test. The 2 groups were well matched by the number of comorbidities. The not-vaccinated had a higher prevalence of anxiety and depression but a lower prevalence of asthma, diabetes, ischaemic heart disease, cancer and obesity. A profound reduction in all-cause mortality in the vaccinated again mirrors the reduction in Covid-19 mortality. VE was reported as 86% against Covid-19 mortality at 84 days follow up. The reported incidence-rate ratios for Pfizer-BioNTech were 0.14 for Covid-19 mortality and 0.18 for all-cause mortality, again a remarkably similar reduction in both outcomes suggesting confounding.
Kaura et al. reported mortality, expressed as incidence rate per 1,000 person-years (PY) (Figure 5). Non-Covid-19 deaths in the not-vaccinated can be calculated from figures in table 2 to be 8.08 per 1000 PY, and non-Covid-19 deaths in those vaccinated with Pfizer-BioNTech to be 1.46 per 1000 PY, giving an RR of 0.181 and a VE against non-Covid-19 death of 82% — a finding essentially indistinguishable from the reported 86% VE against Covid-19 mortality itself.
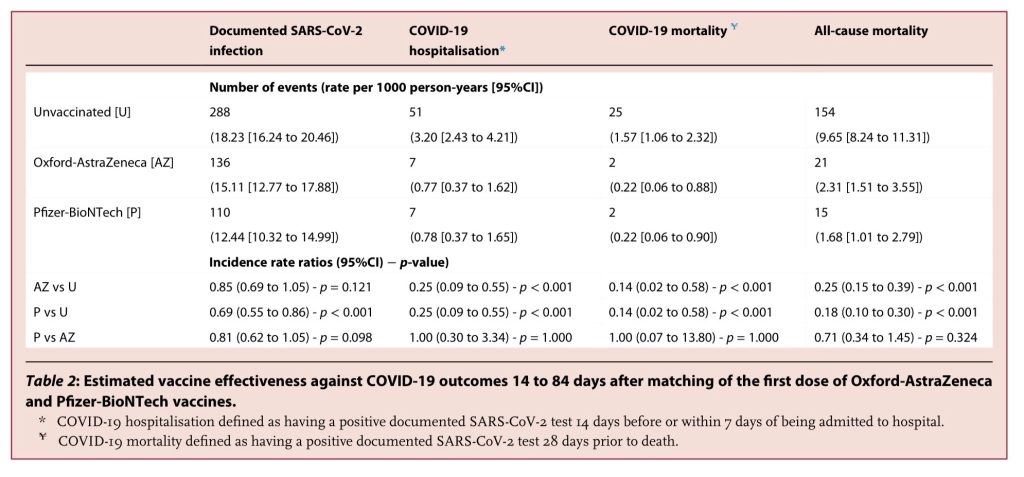
Figure 5. Table of results from Kaura et al.
If observational studies showed profound reductions in non-Covid deaths after vaccination, can we test if this is a real benefit?
We can test this by using the observational data to estimate how many counterfactual all-cause deaths it would predict in the Pfizer-BioNTech randomised trial.
Kaura et al. reported an incidence-rate ratio (IRR) for all-cause mortality of 0.18 (95% CI 0.10–0.30) in vaccinated individuals. In the Pfizer-BioNTech trial there were 14 all-cause deaths in the placebo group and 15 in the vaccine group. Before applying Kaura’s estimate, Pfizer’s counting window for deaths needs to be adjusted to fit Kaura’s ie. deaths between days 14 and 84 after dose one. This can be done using data from table 16.2.7.7 ‘Listing of Deaths’ included in the FDA/Pfizer documents which Judge Pittman ordered to be released – giving 9 and 7 all-cause deaths respectively.
Applying Kaura’s IRR of 0.18 to the vaccine arm’s observed mortality gives the counterfactual rate that arm would be expected to show without vaccination (if Kaura’s effect size represented a real reduction in all-cause deaths) as 7 ÷ 0.18 ≈ 39. But as this data is from a randomised trial we can directly compare the counterfactual estimate of 39 deaths without vaccination, with the randomised trial’s own placebo arm mortality data, which recorded only 9 deaths.The observational data findings of reduced non-Covid and all-cause deaths are not consistent with the randomised data, and the apparent benefit is not confirmed, suggesting the apparent all-cause benefit is due to bias.
A similar counting window corrected comparison can’t be made for Covid-19 deaths as the only vaccine group death was on day 110, leaving a numerator of 0 within Kaura’s counting window, but an uncorrected comparison using Kaura et al.’s IRR of 0.14 would predict 7 Covid-19 deaths in the placebo group, not the single placebo-only death seen in the randomised trial.
Why the early Covid vaccine rollout environment may have amplified healthy vaccinee bias and introduced other sources of bias
- Vaccination started during an active pandemic wave, making infection shortly after the vaccination decision more likely.
- Vaccination took place in care homes during outbreaks.
- Vaccination began in care homes, where frailty was concentrated.
- Intensive outbreak testing increased opportunities for differential misclassification.
1. Vaccination into a pandemic wave.
The HVE is strongest when exposure to the pathogen occurs shortly after the vaccination decision, when the imbalance in baseline mortality risk between vaccinated and unvaccinated individuals is greatest. As time passes after the vaccination decision, frail unvaccinated individuals die from their underlying conditions, reducing the imbalance between groups. As 53% of care homes in England experienced an outbreak in January or February 2021, it is likely that many care homes had a Covid-19 outbreak shortly after the first dose was administered.
The HVE after the Covid-19 vaccine rollout would therefore be expected to be larger than after an influenza vaccine rollout as the latter is given before the influenza season and not into a wave of influenza infection. After influenza vaccination there is more time for the frail unvaccinated to die before encountering the infection.
2. Vaccinating during a care home outbreak.
Vaccinating into a wave also led to the situation of vaccinating care home residents during an outbreak in their care home. This added a novel variant of HVE, target-disease-specific healthy vaccinee bias. A January 2021 guidance letter sent out by NHS England stated:
‘We are aware of there being some uncertainty around vaccination in care homes where there are COVID-19 cases or an outbreak. However vaccination should still take place in care homes with outbreaks.’
When a vaccinator arrived at a care home during an outbreak, those who were too unwell to be vaccinated would now include those with a SARS-CoV-2 infection who would go on to die of Covid-19. These residents would have Covid-19 on their death certificates and a positive PCR test, and were not-vaccinated. It’s difficult to imagine a more effective way of feeding bias directly into mortality observational data. If 1 or 2 residents were already on end of life care when the vaccinator called, an apparent vaccine benefit could be seen in observational data in as little as a couple of days.
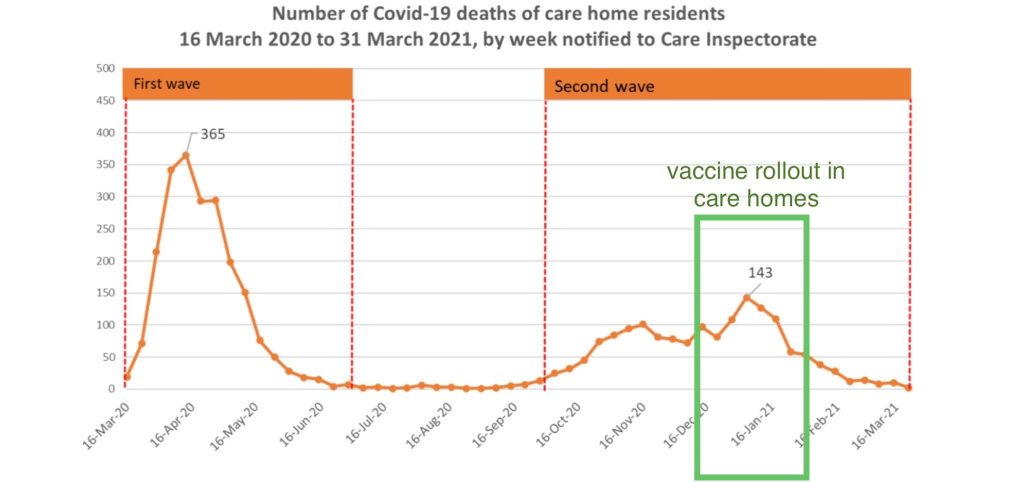
Figure 6. Care home deaths during the first and second waves in Scotland, with first dose rollout to care homes added in green window to the Care Inspectorate’s graph.
3. Starting the rollout with care home residents.
A vulnerable elderly population can readily trigger the HVE as there will always be unvaccinated residents in their last weeks of life who are at risk of terminal pneumonia. As care home residents were the first to be vaccinated and the most likely to die of Covid-19 or any cause, their deaths strongly influenced results from the first data collections onwards. The early mortality data collections likely influenced important policy decisions.
Giddings et al. found over January and February 2021 in England, 53% of LTCF (long-term care facilities for adults aged over 65) experienced a Covid-19 outbreak with a mean duration of 48 days, 12.67% of residents were infected during an outbreak (a mean of 5 residents per home), and the proportion of residents dying from Covid-19 in an outbreak at this time was 3.32%. This gives an implied IFR (infection fatality rate) of about 26% (3.32/12.67=0.262)
Life expectancy in a care home is short due to age, frailty and existing illness. A Scottish pre-covid study found median survival after entering a care home was approximately 1.7 years, with 3.2% of residents dying within one month. In pre-Covid England, there were 391,972 occupied care home beds in 2019, and 131,149 residents died. This implies that a persistent fraction of residents are in the last weeks of life at any given time, and could be considered as frail in the weeks or months before death (on average about 2.8% die per month although there is also seasonal variation with deaths about 9% higher in winter). When an outbreak strikes a care home, these approximately 3 per 100 residents will die per month anyway, whether they are infected with Covid-19 or not. As an average outbreak in England lasted 48 days, the proportion of residents expected to die anyway during that time would be about 4.5%.
4. Testing
In England, care home staff were having weekly PCR tests and residents tested monthly. All residents and staff were PCR tested on days 1 and between days 4 and 7 of an outbreak, and at the end of the outbreak 14 days after the last positive test. LFTs were being increasingly used especially for staff testing in January 2021. Testing could establish the presence and scale of an outbreak, but establishing cause of death in an individual is more nuanced.
Extensive outbreak testing increased the opportunity for incidental SARS-CoV-2 detection among unvaccinated residents already approaching death from another cause, introducing a potential source of differential misclassification. A small Spanish study during the 2016-17 influenza season found 47% tested PCR positive for a respiratory virus immediately after death.
The possibility that there was differential testing or testing bias – in which the unvaccinated were tested more often than the vaccinated – is raised by the findings of a qualitative assessment report which stated:
‘The accuracy of RT-PCR was highlighted as a problem, especially for the initial PHE tests. The rate of false negatives was reported as high by clinicians, resulting in re-testing (and/or ignoring a negative test result), when COVID-19 was highly clinically suspected.’
This also raises the possibility of differential misclassification of cause of death. In the Pfizer-BioNTech trial there were 5 deaths from pneumonia before the data cutoff, only 3 of which were due to Covid-19. If negative tests were ignored in the unvaccinated with pneumonia, with repeat testing or a death diagnosis of Covid-19 regardless of testing, then there was the potential to substantially increase the number of deaths attributed to Covid-19 pneumonia on death certificates in the unvaccinated.
5. Staff shortages in care homes
In December 2020, during the second pandemic wave when early observational data was being collected, and on which important decisions would be based, the BBC interviewed one Somerset nursing home proprietor about the situation. She described the unfolding tragedy as follows:
| “And then it just hit us and just went around the home like wildfire. It was horrific.”Nearly half of the home’s residents died and at one point 80% of the staff were sick or having to isolate.At one point she decided the home was so unsafe it should close, but was told there was nowhere else for her Covid-positive residents to go. “So literally, I had no choice.””It was a living hell, I can’t make it sound anything better than that.” |
Severe staff shortages may have increased mortality through mechanisms unrelated to SARS-CoV-2 infection, including dehydration, lack of nutrition, falls, pressure sores and delayed recognition of illness. If such deaths occurred during recognised outbreaks, there was potential for some to have been incorrectly attributed to Covid-19.
The magnitude of any such effect remains uncertain but the implications of these conditions are profound. The factors affecting life and death in a care home at this time were clearly multiple, complex and powerful and this alone would make any observational data collected on vaccine effectiveness against death highly questionable.
Conclusion to part 1
The Inquiry’s estimate of lives saved is based on vaccine effectiveness estimates derived from observational studies. Such studies show vaccination produces not only an apparent reduction in Covid deaths, but also an implausible reduction in non-Covid deaths of similar magnitude. Figure 7 shows an example of vaccination associated with an apparent reduction in non-Covid deaths of 72%.
| Observational data on Covid-19 and non-Covid-19 deaths in the boosted and not-boosted, based on Hulme et al, for individuals aged under 65, days 29-70 following first booster, with rates adjusted to per 100,000 person-years (PY) | ||
| Covid-19 deathsper 100,000 PY | Non-Covid-19 deathsper 100,000 PY | |
| Boosted | 10 | 153 |
| Not-boosted | 49 | 545 |
| Deaths apparently prevented by vaccination | 39 | 392 |
| % of deaths apparently prevented by vaccination | 80% | 72% |
Figure 7. Comparing Covid and non-Covid deaths in the boosted and not-boosted, in those under 65 years old.
Healthy vaccinee bias is the proposed mechanism for the confounding, while negative-control outcomes are the empirical evidence that substantial residual confounding remains after statistical adjustment.
Part 2 will consider how identification of residual bias can be formalised, and how newly emerging methods of using non-Covid deaths as a control can correct for frailty-related HVE bias to produce a bias adjusted estimate.