

What does the study with the most ambitious claim show?
Dr Clare Craig
| Key points Canada claims the highest reduction in neural tube defects from folic acid fortification anywhere in the developed world – 46 percent. The United States with a near-identical programme claimed only 19 to 28 percent. The 46 percent comes from one study with no control group. The rate of neural tube defects in Canada was already falling steeply year on year but this decline was ignored in their calculations. The paper also claims that higher-risk provinces benefited more, but their data does not support this either. |
There are a wide range of claims of the effectiveness of what are very similar laws mandating folic acid on the reduction in neural tube defects. These range from 14.4 percent in Australia through 19 to 28 percent in USA right up to the bold claim of 46 percent in Canada.
The Canadian claim is based on one study published in the New England Journal of Medicine in 2007 by De Wals et al. It is a large surveillance study looking back at the impact on pregnancies and births. It is worth looking closely at how they reached their claimed figure.
What did they measure?
The investigators identified 2,446 affected pregnancies among about 1.9 million births in seven of the ten provinces between 1993 and 2002. All affected pregnancies were counted including live births, stillbirths and terminations. They selected three periods to examine and reported that incidence was 1.58 per 1,000 births before fortification and 0.86 in the full fortification period. The period when manufacturers made the change was excluded. That is the 46 percent reduction. The claimed fall of 7.3 per 10,000 pregnancies works out at 4.19 fewer terminations, 2.79 fewer affected live births and 0.32 fewer stillbirths.
The baseline
In order to claim something changed there needs to be an estimate of what would have happened otherwise. In this instance they selected a flat baseline from 1993 to 1997 before the law changed. That means they could assume that the rates would not have fallen at all without the government intervention.
The same researcher had already published a paper on the rate of pregnancies affected by NTDs in two regions of Quebec in 1992. De Wals and colleagues recorded the rate as 1.41 per 1,000 in 1992 and described it as a threefold reduction over the preceding three decades.
Yet, the study compared the apparently flat pre-fortification period with the apparently flat post fortification period and ignore the overall decline completely.
There is no national data that includes all pregnancies with which this baseline can be compared. The closest is to compare registered births but these may not be representative of the pregnancies during a time when the rate of terminations changes.
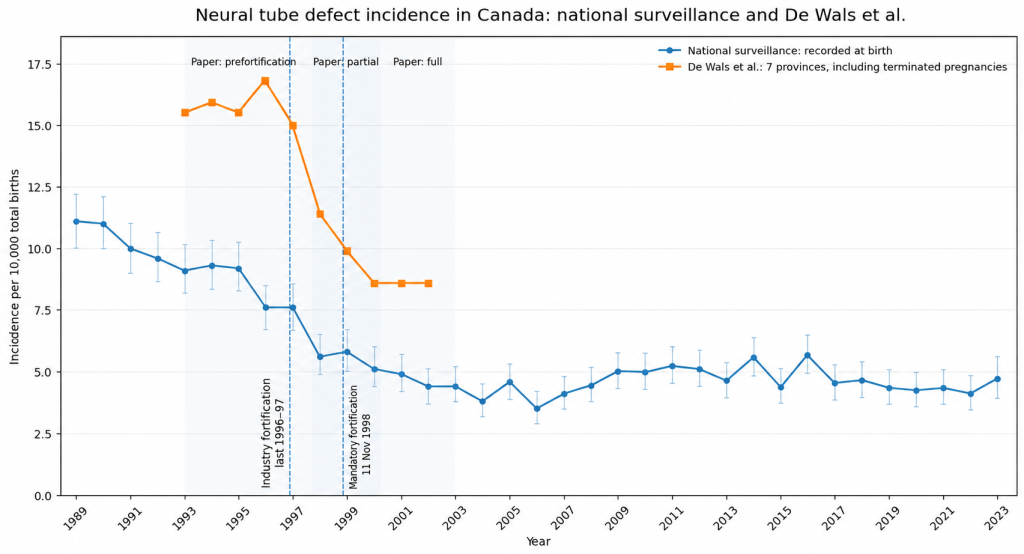
Figure 1: Incidence of neural tube defects at birth (blue line) and incidence in all pregnancies in NEJM study covering 55% of Canadian population (orange line) with 95% confidence intervals.
Falling births
From 1989 to 1997 there was a year on year decline in affected births which was seen across the western world. Roughly half of the decline in affected births from 1989 had happened before the mills changed. Could this have been an increase in terminations? That must be part of the reason. Ultrasound diagnostics was improving and becoming more readily available leading to terminations in early pregnancy.
The more gentle background decline is seen in births with a fall in 1996 and a continuing fall after 2000. Scaling the births to the study data shows this more clearly. If the proportion of affected pregnancies that became live births stayed constant then the two lines should track. The fact the align at the beginning and end of the period suggests this is a fair assumption. The live births figure for the whole country (in orange) shows a gradual decline. The figure from the paper shows a sudden uptick before a steeper decline. Ultimately the whole trajectory ends where you would expect it to if the only decline had been from the background falling rates that were evident before and after the period in question.
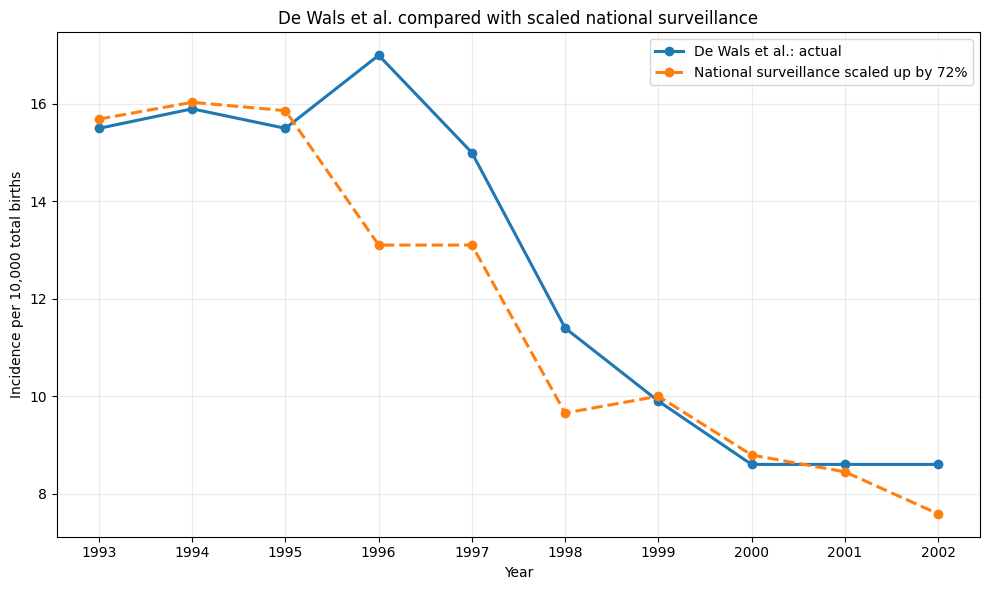
Figure 2: The same two series with the birth record scaled up by 72 percent so that the two averages match. Scaling by a single constant assumes that the ratio of pregnancies to births was constant i.e. that the proportion of affected pregnancies ending in termination held steady. Given the alignment at the beginning and end of the period that seems reasonable.
1998 to 2002
Ontario was not included in the study. The total rate of affected pregnancies there rose from 11.7 per 10,000 pregnancies in 1986 to 16.2 in 1995, then fell 47 percent by 1999. The decline began two years before the addition of folic acid began and was completed before the paper’s “full fortification” which started in April 2000.
Given the known earlier fall in Ontario of the same magnitude as the claim which was unrelated to folic acid, questions must be asked about how much of the later fall in the other provinces would have happened anyway.
It is worth noting that miscarriages were excluded from this data. If a woman had a pregnancy loss before a diagnosis then that pregnancy would not be included in the data. There is evidence that folic acid increases pregnancy losses creating an illusion of benefit.
End of the decline
Whatever had been causing the decline before fortification, once folic acid was added that decline ends. The same was seen in USA.
Conclusion
It is fair to say that affected pregnancies reduced during the period folic acid was introduced. However, it is bad science to make a claim of a measurement for that reduction while paying no attention to the underlying background decline. Even with a good measure of the size of the decline, the fact that pregnancy losses increase with folic acid exposure must also be accounted for.
This is “The Science” that Britain is following.