Show us the results!
Much attention has been given to the Pfizer/BioNtech trial because a Texan court ordered the release of the documents the FDA used as a basis for their approval. It is time to shed more light on the AZ trials.
The key to understanding how the results have been distorted is to understand a principle of fair trial analysis called the “intention to treat.” This requires that analysis is done on outcomes based on the groups people were originally randomised to, no matter what happened to them subsequently. That way there is no possibility of cheating the results. It is particularly important in the case of the covid vaccines because of the high risk of infection seen in the first two weeks after injection. Excluding this period creates a bias such that an illusion of efficacy is created when all that might have happened is that infections in the vaccinated occurred earlier.
For the AstraZeneca trials (and others) this analysis was never done. But a surrogate marker was carried out in the last trial and which is very revealing.
Let’s work through the trials chronologically looking at efficacy then safety each time.
Off to a terrible start – phase 1/2
The first sign that all might not be as was being portrayed was reported in May 2020 when a trial in Rhesus monkeys did not reduce infection rates or the amount of virus produced. This was ignored and human trials went on.
Trials are meant to start with safety analysis only (phase 1) before going on to a small number to check for safety and efficacy (phase 2). Normally, these would be completed before starting a larger safety and efficacy trial (phase 3) to provide sufficient evidence for approvals.
Phase 1
The original proposal was to carry out a study on one dose and two phase 1 and 2 trials were initiated, one in South Africa and one in the UK.
The UK Phase 1 / 2 study
The original protocol had been for a placebo controlled trial including two groups, 1b and 2b, who would receive a saline placebo. Within a week this was changed to a meningococcal vaccine and by the 20th April version the words “placebo controlled” had been removed.
The plan changed over time. The original trial end date was May 2021 which included 6 months follow up and an optional one year follow up. From September 2020, the follow up was extended to 15 months from enrollment and the end date was pushed back from May 2021 to October 2021. Was this to increase follow up for safety issues? No. The new protocol says serious adverse events would be followed up “until a cutoff date of 1st July 2021 or 6 months post late vaccination visit, whichever is latest.” The 6 month follow up only applied to serious adverse events in their questionnaire (pain, redness, warmth, itch, swelling, induration, tenderness, fever, chills, joint pain, muscle ache, fatigue, headache, malaise nausea). The real concern is for serious adverse events not included in their questionnaire but reported by participants. The original protocol called for only 28 days of follow up and the newer protocol had shorter follow up in some instances saying “Occurrence of unsolicited adverse events (AEs) for 28 days following vaccination (7 days following vaccination for groups 1c, 1d, 5a & 5b).” Is 7 days follow up really adequate? Why was it changed?
The October 2021 end date came and went. Then in January 2022 a final amendment was added which pushed the end date to March 2023. No other changes were made to the protocol at that point. Another 17 months for what?
What did they find?
In this first trial, 1077 participants were enrolled between 23rd April and 21st May 2020 to test one dose (and ten received two doses). Their primary outcome was for PCR positive symptomatic covid and serious adverse events with various other measures as secondary outcomes. They have never reported on the number of PCR positives in this group (only with the collated data from other trials). Instead the paper reports only on immune cell responses in the blood and admits “The immune correlates of protection against SARS-CoV-2 have not yet been determined.” This remains true to this day.
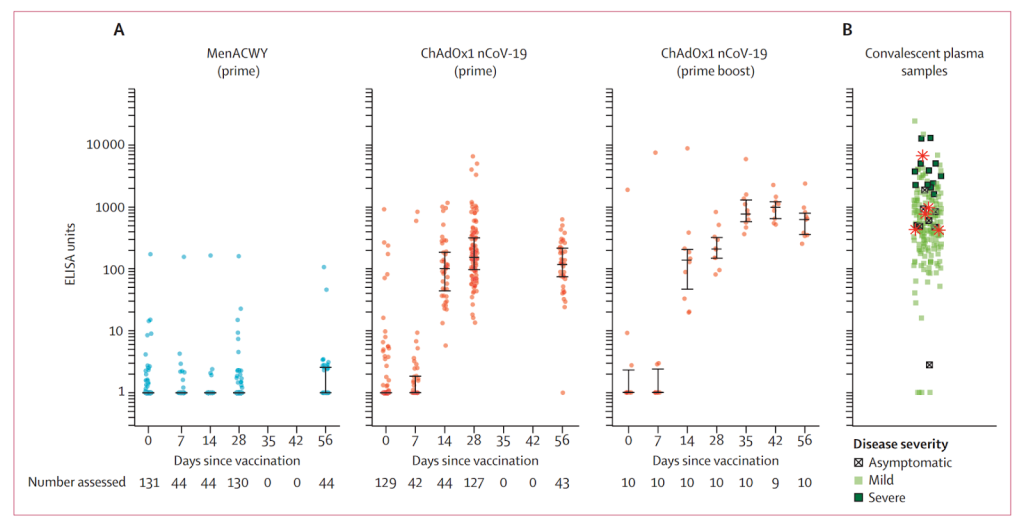
Figure 1: A logarithmic graph of the level of antibodies in the blood for the meningitis vaccine group (MenACWY), the single dose group (prime), the two dose group (prime boost) and for patients who had had covid (convalescent plasma samples).
Figure 1 shows how patients who had had severe covid (dark green squares right hand graph) had substantially higher antibody levels than those with one dose (second graph) and even those with two (third graph). Remember this is a logarithmic scale so the differences are huge.
The researchers reported that “A single dose elicited both humoral and cellular responses against SARS-CoV-2, with a booster immunisation augmenting neutralising antibody titres.” To make the case for two doses they needed another trial.
The South African phase 1 / 2 study
A month after recruitment ended in the UK, a second phase 1 /2 trial began in South Africa just at the beginning of the first South African covid wave. Recruitment ran from 24th June to 9th Nov 2020 and 2,070 people were recruited. The placebo was normal saline for this trial and follow up was for a median of 22 weeks before publication of the interim results.
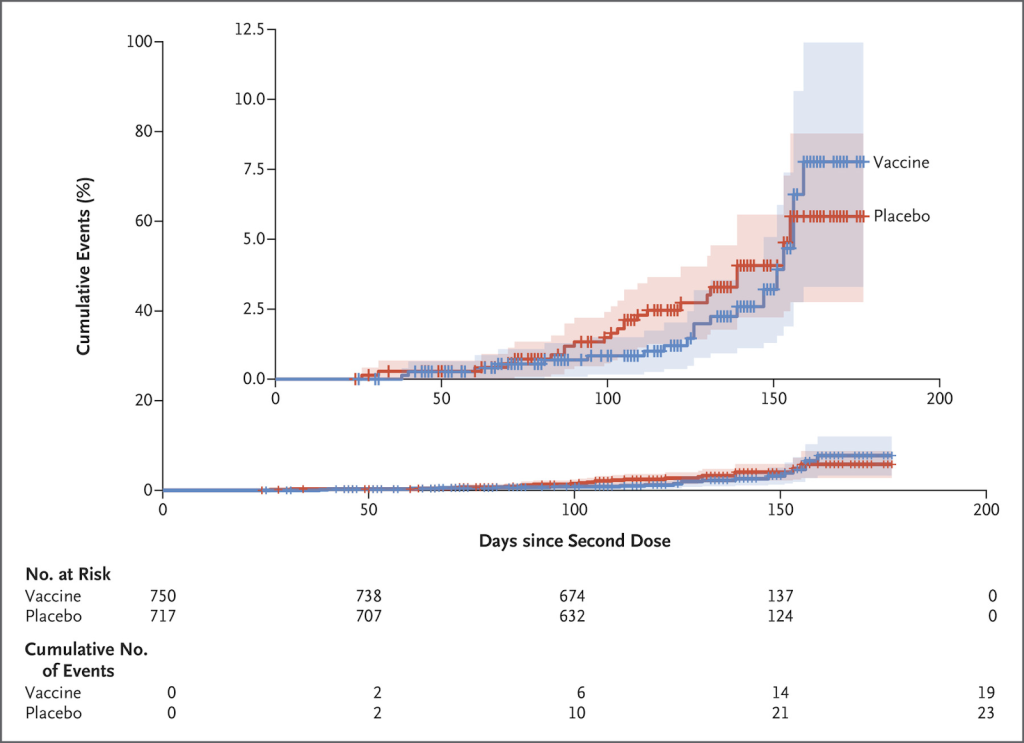
Figure 2: Cumulative PCR positive covid cases after the second dose.
Again, there is no mention of the incidence in the period after the first injection. There were a total of 23 placebo “cases” and 19 vaccine “cases” with no severe cases and no hospitalisations. This vaccine failure was blamed entirely on the Beta variant circulating in South Africa at the time.
In normal times this result would have put an end to any phase 3 trial. This is the same team who were commencing children on an AstraZeneca vaccine trial before they even had any safety data in adults. HART has some interesting emails regarding the children’s trial here.
Phase 3
Because of the rush of “operation warpspeed” phase 3 trials were started before completion of phase 2 or 1. The trial was expanded to Brazil and much wider in the UK, enrolling nearly 24k people, just over 10,000 more from Brazil from June 2020 and 10,000 more in the UK.
Interim
The results were first published on 8th December 2020 which led to temporary authorisation and rollout. The interim analysis included all 23 848 participants for safety but only 11 636 participants for efficacy. All the South African participants were excluded from the calculations of efficacy. No explanation is given as to why.
Efficacy
The two groups that were included were 71% of the UK participants recruited after 28th May and 41% of the Brazilian participants recruited from 2nd June 2020. In both cases a meningitis vaccine was used as the control, not saline. The data included follow up to 4th November 2020. During this period Brazil had substantially more covid than the UK – as compared by overall covid mortality per million (see figure 3). (Comparing cases cannot account for much higher testing levels in the UK). Remember that recruitment is progressive so a far smaller proportion were included during the earlier months compared to the later months. You might think the Brazilian trial site would have seen higher rates of covid in the trial. The reported rates in the unvaccinated were 1.8% of the UK cohort and 1.6% of the Brazilian cohort. Does that ring true?
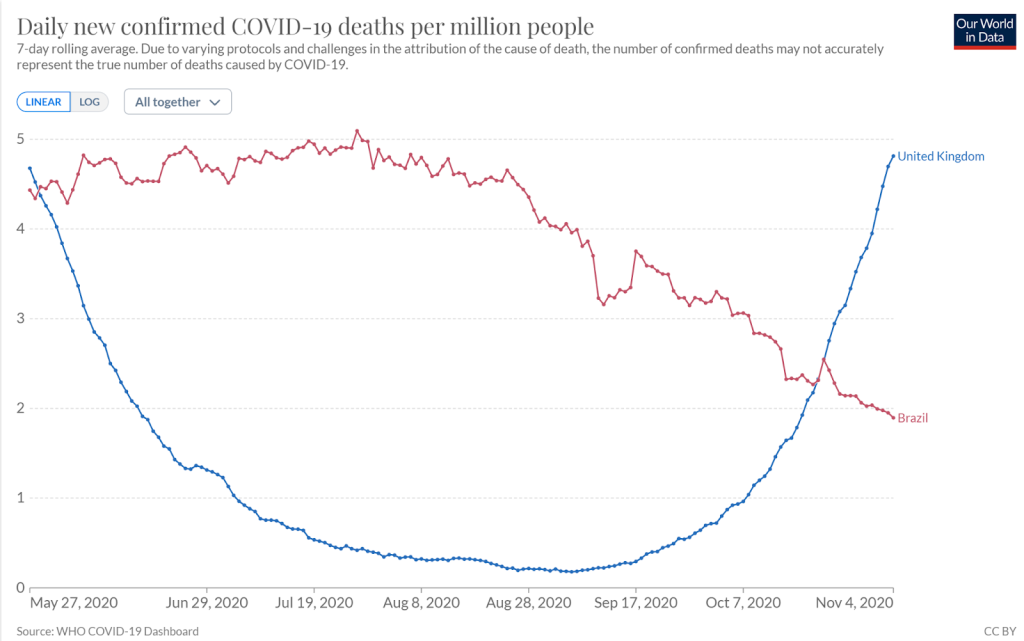
Figure 3: Covid deaths per million in Brazil and UK during period included in interim analysis
The original sample size calculation assumed that 5-20% of the unvaccinated population would have covid during the course of the study. When reality hit this was reduced to 2.5%. It also assumed only 10% would be lost to follow up. In reality, the interim analysis was carried out on only 48% of the whole cohort. Reducing the sample size so much reduces the chance of finding a meaningful result. Analysing multiple subgroups within the sample, increases the chance that one of them will have a more favourable result and that is what they did.
In the main analysis there were 30 covid ‘cases’ in the vaccine group and 101 in the placebo group making for an efficacy of 70%. In other words, 82 people had to be vaccinated to prevent a single ‘case’ more than two weeks after the second dose. For the participants that received a standard dose there were 27 cases out of 4440 in the vaccine group and 71 out of 4455 in the control group giving an efficacy of 62%. If the South African cohort had been included the efficacy would have been 51% – only 1% above the WHO baseline for approval of vaccines. (Even then this excluded any additional cases that occurred in the vaccine group up to two weeks after the second dose).
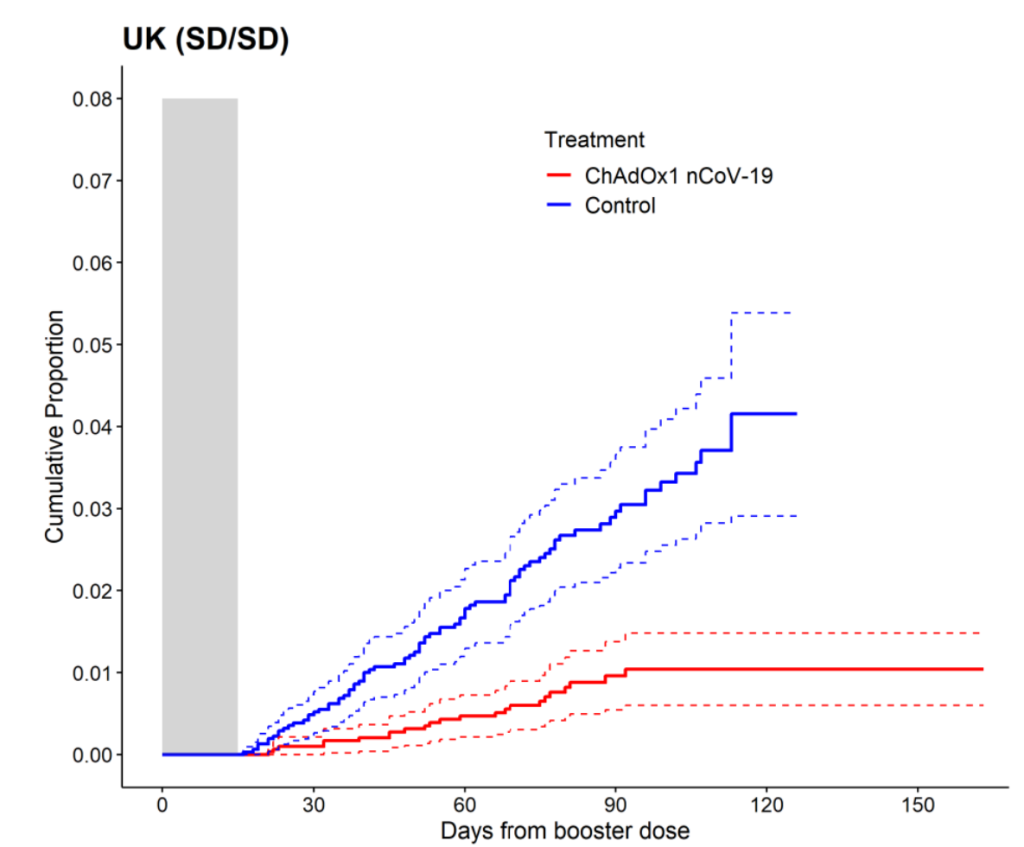
As well as ignoring the period in the first two weeks in the analysis, they covered its modesty with a grey box on their graphs.
Figure 4: Cumulative proportion infected (this is higher than the percentage of participants at the end point because it is modelled to assume all participants had as much follow up as those in the trial the longest).
Severe disease and death
The goalposts were changed for analysing the significance of severe disease and death and were measured, not from two weeks after the second dose but from 21 days after the first dose. By this measure overall efficacy was 64% and efficacy for any positive test result was only 46% (table 4). With this new timing they managed to squeeze out a difference with two severe covid cases and one death in the placebo arm and none among the vaccinated. On this basis a press release was issued claiming 100% efficacy against severe disease and deaths which was repeated by influential and powerful people on mainstream media.
Final analysis before approvals
A further publication includes analysis of all participants, including an extra month of follow up to the 7th December 2020.
Efficacy
30% of participants were still excluded from the efficacy analysis. The exclusions were spread fairly evenly and the percentage of participants included were 69% for the UK phase 1/ 2 participants, 77% for the remaining UK participants, 71% for South Africa and 68% for Brazil. However, it is such a substantial number of exclusions that the results must be called into question. What would an “intention to treat” analysis have shown? The reported number excluded because of testing positive was similar in each group but we do not know how many of the participants excluded for other reasons also tested positive.
By looking at only 70% of the cohort and only looking at the period more than 14 days after the second dose, they claimed 2.9% of the placebo group had covid in that period. The implication is that a third of the cases occurred in November 2020. While that seems likely for the UK cohort, it is hard to believe for the Brazilian and South African cohorts when overall covid rates had dropped considerably (see figure 5). Data was not provided by country.
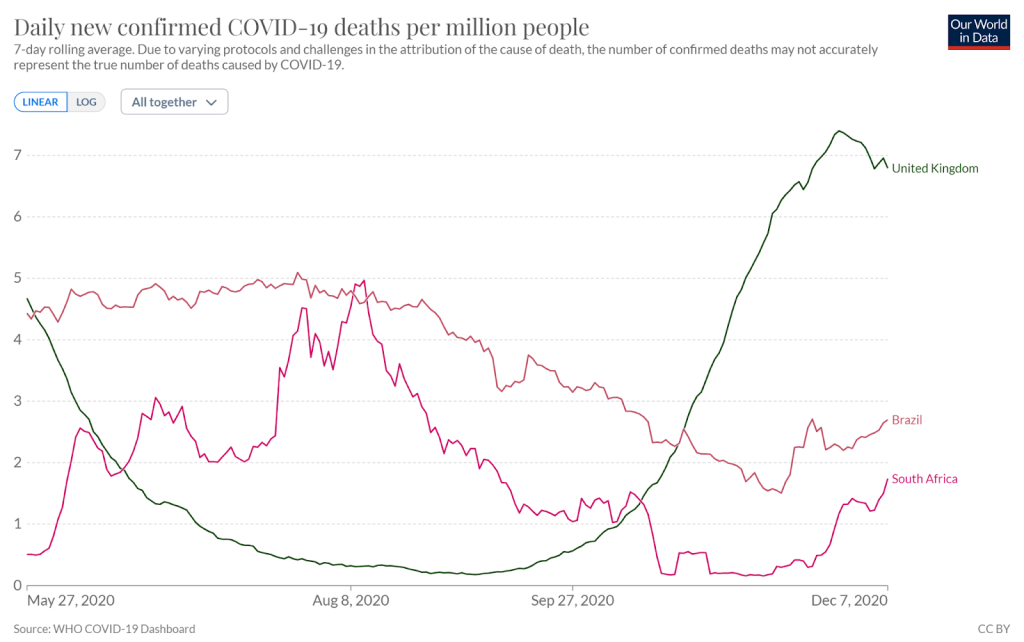
Figure 5: Covid deaths per million from the beginning of the bulk of the recruitment period for phase 3 through to end of final reporting period.
The study claimed 76% efficacy in the first 90 days after vaccination but does not make clear whether that was from the point of vaccination or a period after that point. Overall the study reported on 84 cases more than 14 days after the second dose in the vaccine group and 248 in the placebo group, giving an efficacy of 67%. In other words, 162 people would need to be vaccinated in order to prevent a single case in the period more than two weeks after the second dose. That number might have improved after a longer follow up period but given that we are told the effect might wanes after a few months at most it is unclear how generous to be about what might have happened longer term. Over that same period there was one more severe case reported in the placebo group and no further deaths.
The authors continued obscuring the first two week’s data using a grey box.
Second phase 3 trial
A further study was carried out between 28th August 2020, and 15th January 2021 in Chile, Peru and the US. They used two doses four weeks apart and had a saline placebo given to half as many people (10,816) as were vaccinated (21,635).
3,126 (10%) of the participants were excluded because they had had less than 15 days follow up after the second dose. Why on earth didn’t they just wait a few more days?
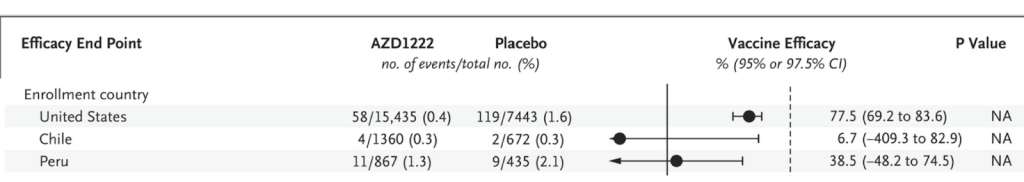
They claimed an efficacy of 74% (73 cases vs 130). However, the supplementary data says that this efficacy was not based on all the cases, “The estimated vaccine efficacy for incidence of first SARS-CoV-2 RT-PCR–positive symptomatic illness occurring post first dose of trial intervention among participants in the full analysis set who were SARS-CoV-2 seronegative at baseline was 54.5%” (287 cases vs 303). Remember there were twice as many people in the vaccine group which is why the absolute numbers in each group look similar.
Again there was a marked difference in efficacy between trial locations with both Peru and Chile not seeing statistically significant benefit.
Severe disease and death
Eight severe covid cases presented in the control arm based on the very subjective definition which included “clinical signs at rest indicative of severe systemic illness”. There were none in the vaccinated group. There were seven deaths in total in each group despite the smaller placebo group. Two covid deaths were both in the placebo group. The implication is that vaccinating 5,000 people would prevent a single covid death over the course of a median of three months from first injection.
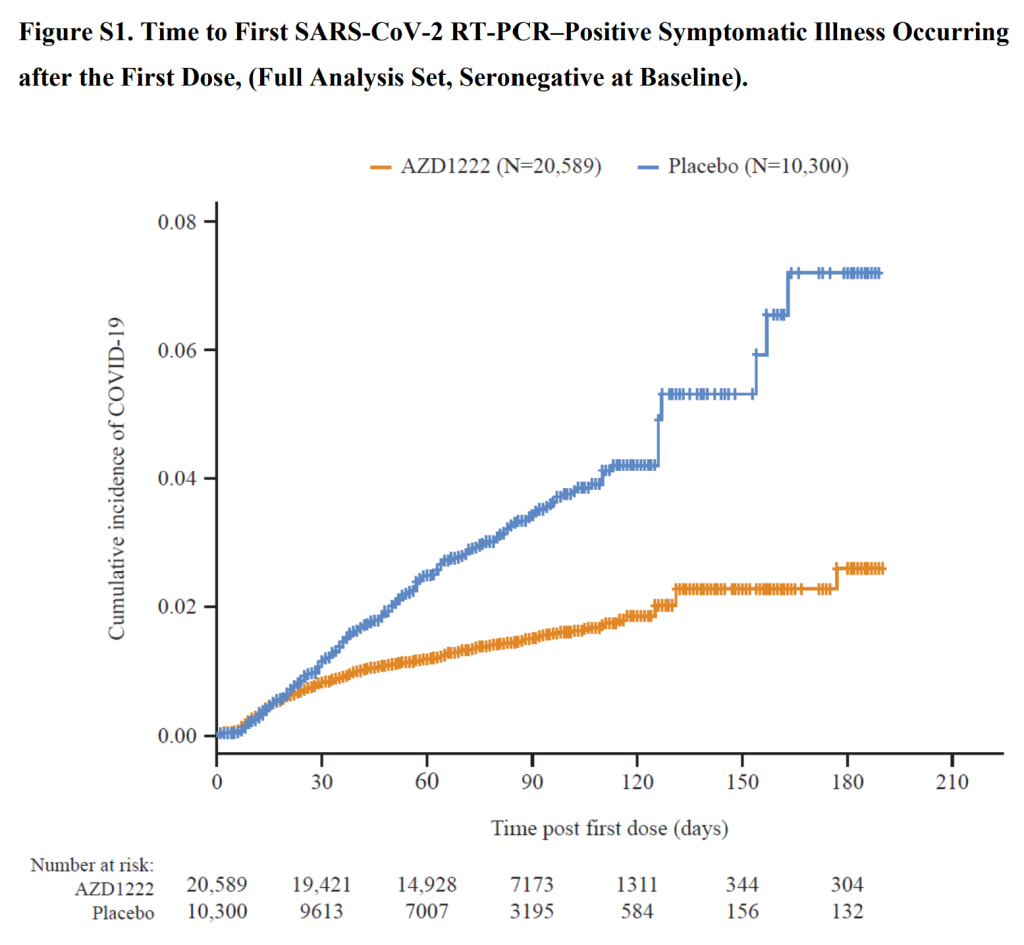
For the first time, the time period after the first dose was disclosed in the graphs. However, the perfect match shown here does not concur with what was observed in the real world in the period two weeks after the first dose when a much higher infection rate was evident in the vaccinated.
Intention to treat analysis
A fairer way of measuring effectiveness is to measure the number of participants who developed antibodies because of an infection (N antibodies). This measure is an intention to treat analysis. In this study there was 64% efficacy by this measure (156 (0.9%) vaccinated with antibodies and 202 (2.4%) in placebo group). It was shown that the Moderna trial vaccine recipients were less likely to make N antibodies (only 40% of vaccine recipients developed N-antibodies after infection compared to 93% of placebo recipients). Given that vaccination had equipped their immune system with spike protein antibodies to fight off infection, it is perhaps no surprise that these were then put to use and no N-antibodies were created. If the same issue occurred after the AstraZeneca vaccine then the 156 with antibodies would represent a total of 390 infections among the vaccinated. The efficacy in that case would only have been 3%.
Why were the PCR results so different to the antibody results? Astrazeneca contracted a company IQVIA to help gather and analyse the data in this trial. An FOI exposed the fact that this same laboratory had reported over 20k positive PCR results and only 3 negatives when doing real world testing.
Safety analysis
The trial protocols said “As with any other vaccine, temporary ascending paralysis (Guillain-Barré syndrome, GBS) or immune mediated reactions that can lead to organ damage may occur, but this should be extremely rare (1 in 100,000-1,000,000 vaccine doses).”
The trial was paused twice because of serious safety concerns. The first time was in July 2020 when a patient developed multiple sclerosis and the second time was in September when a participant developed transverse myelitis. A further study to look only at safety issues was cancelled at this point.
The purpose of doing randomised controlled trials is to be able to compare important effects between one group and another. For adverse events the vaccinated fared markedly worse than the placebo group on these measures. Overall at the time of first approval the interim study had reported 7 adverse events affecting the nervous system in the vaccine group compared to 4 in the placebo group (the groups were of equal sizes in this study). The vaccine group had a case of multiple sclerosis and one of transverse myelitis.
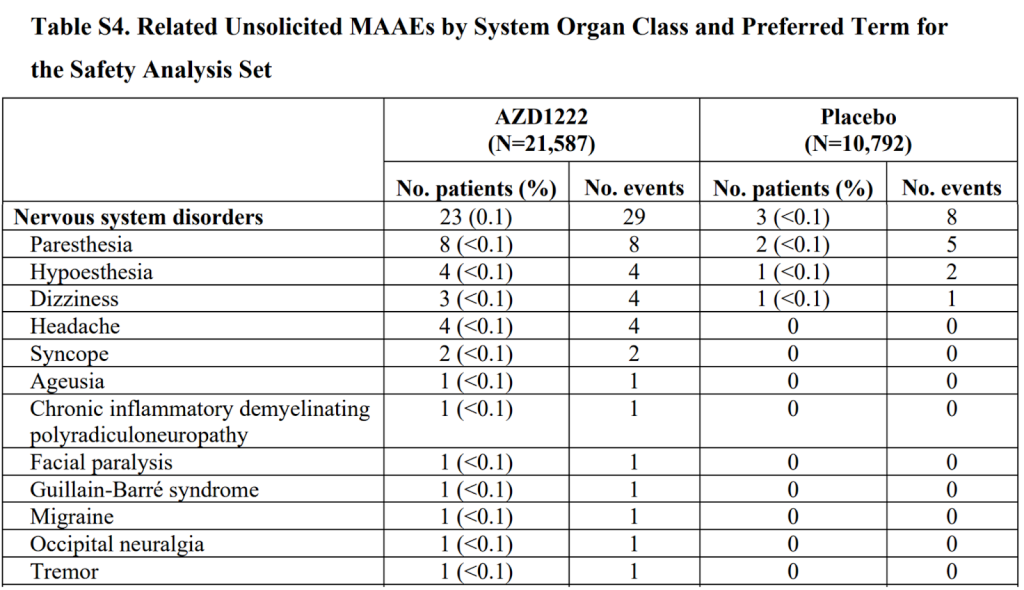
The second phase 3 trial reported 23 participants with adverse events affecting the nervous system in the vaccine group, including facial paralysis, Guillain-Barre syndrome and another rare demyelinating conditions. They reported only 3 in the placebo group (that had half as many people). However, the overall total adverse events reported were lower in the vaccinated group (unlike for the mRNA products). It is worth remembering that the AstraZeneca product was compared largely to another vaccine rather than to a saline placebo.
Overall therefore there were four instances of demyelinating disease in the two trials from 33,608 people, or 1 in 8402, only one potential adverse reaction. In the meantime, the claim regarding efficacy was that 1 in 11,203 would need to be vaccinated to prevent a covid attributed death.
Conclusion
The AstraZeneca trials’ analysis reveals several points of concern related to the trial design, reporting, and interpretation of results. Vaccine efficacy should be constant and yet there was marked variation across trial sites with no evidence of benefit in South Africa, Chile or Peru.
The claimed efficacy of the AstraZeneca vaccine was not reflected in the real world. Claims of 100% efficacy should never have been made based on only a single death in the placebo group. Preventing only a single death after months of follow-up having vaccinated thousands of people demonstrates the very low real world efficacy of the vaccination.
Claims of efficacy against infection seem to be more straightforward at face value. However, a critical issue pertains to the disregard of the “intention to treat” principle, a cornerstone of robust trial analysis, which could have led to skewed results. Particularly concerning is the absence of data from the initial two weeks following vaccination, a period of high infection risk. This omission could inflate the perceived vaccine efficacy.
