
Another failure of peer-review and common sense
The usual covid high priests who have been wheeled out repeatedly in front of the television cameras to fear-monger about covid without any debate, are at it again. Several members of Independent SAGE and others have written a paper assessing the impact of covid on children over the course of the last three years. It is not the paper they wanted to write.
Imagine you were them and had got hold of the data ready to write your paper. What might you want to show? I would suggest their priorities would have been to show:
- Covid caused immense harm to children
- Vaccinated children did not get sick with covid
- Vaccinated children did not go on to get the post-covid immune syndrome PIMS
- Vaccinated children did not die with / of covid
They were unable to demonstrate any of those points using the actual data, as we shall see.
The paper was published in the BMJ but it seems the peer reviewers did not actually do much reviewing. Campaigners who have repeatedly demanded children be vaccinated and who even now are demanding boosters for vaccines (see figure 1) might not be in the best place to provide a dispassionate assessment of the evidence, and indeed they did not.

Figure 1: Tweet from one of the paper’s authors on 11th July 2023 demanding children be able to access booster doses
Who did they study?
They analysed data from England for the entire child (<18s) population, finding over 3 million with positive PCR tests between July 2020 and February 2022. For the same period NHS England reported 21k hospital admissions of children, but these authors found over 29k thanks to their “more inclusive” method of counting any positive test as a covid admission regardless of how ridiculous the association. Indeed, the NHS England claim that Omicron cases were largely incidental was disputed by the authors. In reality of course, many of the positive test results were always incidental. When a virus passes through the community it will also pass through the hospitalised population and they are less fit to fight it off, so of course some patients admitted for other reasons will test positive during a wave of infections. However, NHS England did not want to revisit past categorisation.
The period of the study is very odd. Rather than include admissions for the spring 2020 wave, they did not include any data from before July 2020. They say this was because community testing started then, but a large part of this data is on hospitalised patients for whom there was good access to testing throughout. It makes comparison between waves impossible. Secondly, despite the paper being first accepted in May 2023, the data cut-off is February 2022. Surely, any serious scientists wanting to evaluate the effect of vaccination on the covid in children would not end their study at the point when vaccines were rolled out to 5-11 year olds. This has to raise serious questions about what is being hidden by doing this.
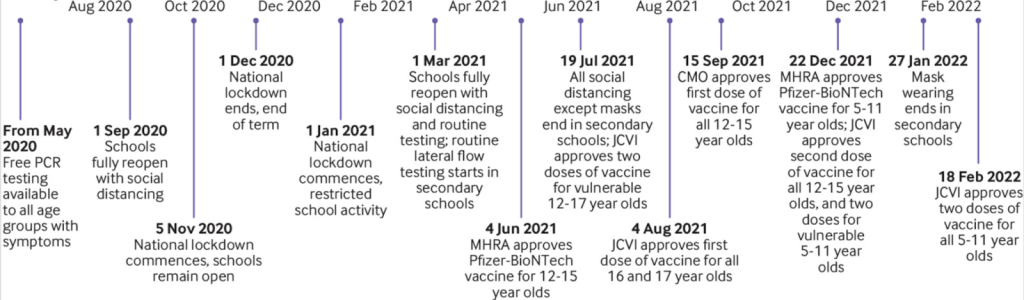
Figure 2: Timeline of study period
A very scary sign of vaccine harm was ignored
The most interesting data – frequently contradicting the main conclusions – is often to be found in the supplement, and this paper is no exception. Figure 3, from the supplement (Fig B, page 13) shows the proportion of admissions by vaccination status.
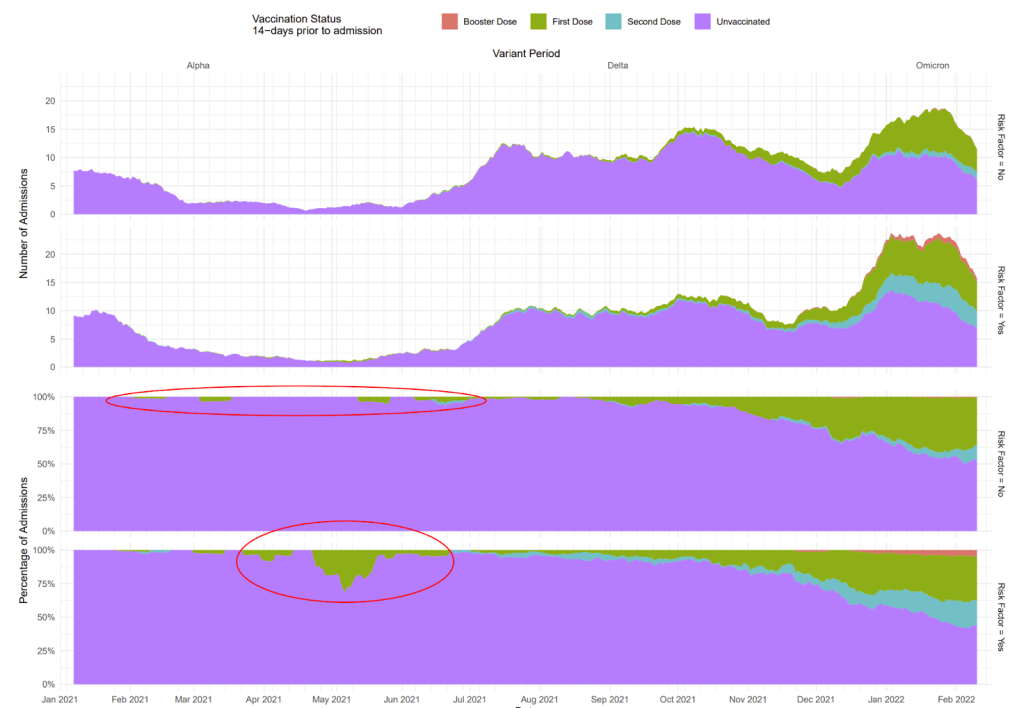
Figure 3: Percentage of admissions by vaccination status
The top red ring added here represents children with zero risk factors who were vaccinated (sometimes twice) and admitted to hospital with covid before 19th July 2021, when approvals were first given to vaccinate vulnerable children. Who were these children, who injected them and why?
The lower red ring shows a period where a minimal number of children had been vaccinated and yet they made up a high proportion of covid admissions. The data on vaccination has been utterly muddied by reporting on the “vaccination status 14 days before infection”. Even after pretending that children remained unvaccinated for a full two weeks after injection, there is still a huge issue highlighted in figure 3. For several weeks, up to a quarter of admissions in children with a risk factor were vaccinated. Could this have been a result of sick children being prioritised for early vaccination? If it was that, why did it settle down again so quickly? Surely, sick children at risk of admission continue to be at risk of admission for many months.
To understand the significance of the high admission rate in the vaccinated at risk group we need to know more about how many were in the “at risk” group and how many were vaccinated. The paper claims that 18% of positive test results were in children who had a supposed risk factor. That implies that 2.2 million of the 12 million children in the country could be categorised as having a risk factor. (The numbers might be affected by higher testing rates in the at risk group, however). How many were vaccinated? More than you might think, given that this was prior to approvals. Up to 19th July 2021, government data shows there were 2,266 doses of vaccine given to children under 16 years old, including 85 doses given to children under the age of 5 years (Figure 4).
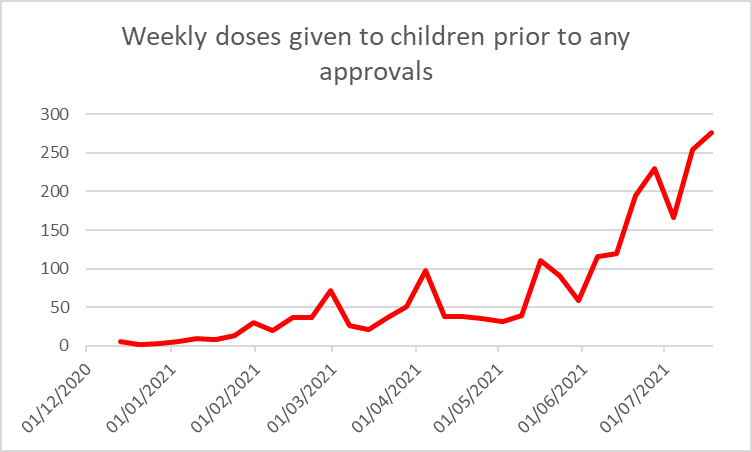
Figure 4: Weekly covid vaccine doses given to children prior to approvals to vaccinate vulnerable 12-15 year olds on 19th July 2021, (see spreadsheets after PDFs each week at link)
Returning to the graphs in Figure 3, these only show the vaccine status at least 14 days prior to admission. In the second week of May, there were 614 children who were more than two weeks after their first injection. These children therefore represented 0.028% of the 2.2 million children supposedly “at risk” yet made up a much higher percentage of hospital admissions in the “at risk” group.
Could this be a small numbers issue, where there were only a handful of admissions? According to NHS England data there were a total of 125 admissions of children with covid in the last two weeks of April and first two weeks of May 2021. Overall the paper claims 54% of admission were among those at risk but at times of low prevalence this may well be higher. Conservatively then, 68 (54% of 125) of those covid admissions were in “at risk” children. Of those, about 25% came from the 0.028% of the population who were vaccinated more than two weeks earlier. Their risk was therefore 1000 times higher (0.028% vs 25%) than if the vaccine had no effect on their risk at all.
There is a clear signal here of children considered to be at risk having a very high hospital covid admission rate, even when ignoring any admissions within two weeks after their vaccination. The admission rate in the first two weeks remains secret, of course. Given what we already know about covid risk in that period it is highly likely that the hidden data would reveal even more evidence of harm. Hiding this evidence is utterly unethical and unscientific and the BMJ should release data from this important period or else withdraw this paper entirely.
Hospital admissions
Covid admissions were categorised into 5 types:
- The clinicians coded covid as a primary admission – Type A1
- Covid was included in the coding but NOT coded by the treating clinicians as the primary reason for admission.
- Type A2 – any patient with “unspecified viral infections, viral conjunctivitis, volume depletion, shock, acidosis, otitis media, croup, non-specific bronchiolitis, cough, fever, vomiting, diarrhoea, myalgia, headache, certain types of arrhythmias, tonsillitis, pharyngitis, and laryngitis”
- Type B1 – admitted child had risk factors such as another infection of conditions that increase risk from covid e.g. diabetes or seizures.
- Type B2 – admitted child at high risk from covid e.g. children with cancer, immunosuppression, neurodevelopmental conditions or respiratory disease.
- Hospital acquired – diagnosed after day 8 of hospital admission
- Incidental – admission was for another reason and no amount of shoe horning could enable them to pretend it was covid e.g. “mental health disorders, eye conditions, dental conditions, injuries, trauma, assault, self-harm, poisoning, surgical problems such as those affecting bowel or testis, and certain pregnancy related conditions.”
Looking at the broad definitions of Type A2, B1 and B2 it is no wonder they found 50% more covid admissions than seen in the NHS England data. A more interesting paper would have looked more closely at those all 9875 admissions and 315 intensive care admissions where the clinician had coded covid as the primary cause of admission and investigated how other doctors would have coded these.
The majority of “covid admissions” described in the study in the first five months of 2021 did not even have a positive test result (see figure 5).
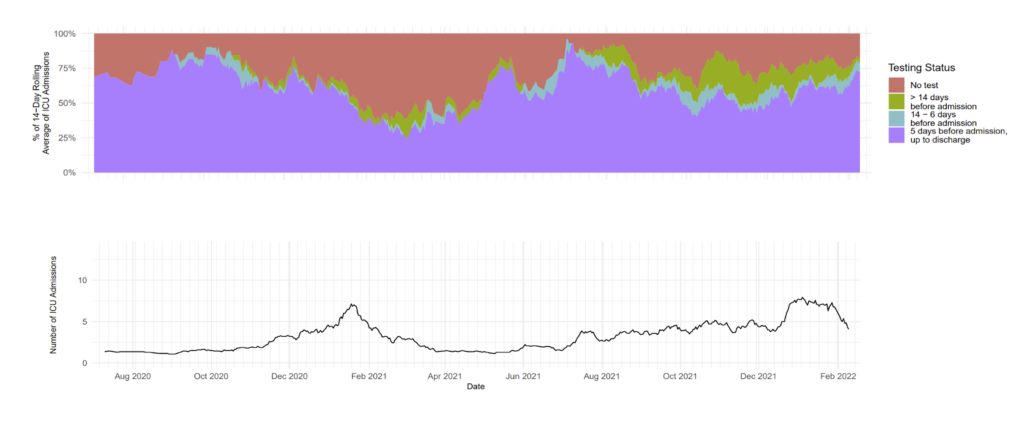
Figure 5: Percentage of admissions by test status. Those diagnosed after admission are grouped with those diagnosed within 5 days of admission.
Only a third of hospital admissions in children were Type 1A – i.e. coded as due to covid. Over a quarter were classified as incidental, as in the scheme above, and the remainder were shoe-horned into being called covid even though the treating doctors had not coded them as such.
Table 1 shows hospital admissions with covid according to the government. Note that the third seven month period (Delta) has roughly twice as many admissions as the first period for each age group except for the 12-17 year olds. For the latter admissions were three times as high during the period of vaccine rollout (during Delta wave) than during the first wave. A constant percentage of admissions were in 5-11 year olds but the admissions in 12-17 year olds is higher in the second period and then higher again in the Delta / vaccine rollout period. It is worth noting that 20,000 doses had been given to 16 and 17 year olds by the end of April 2021, during the second period.
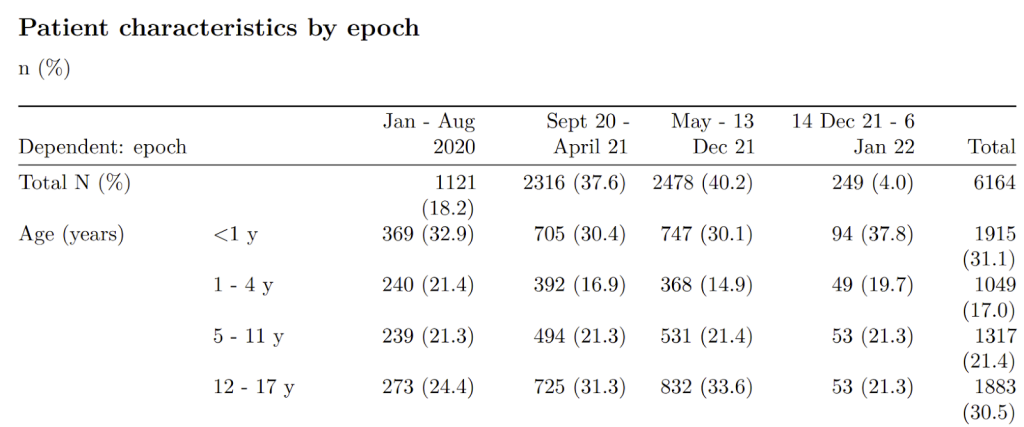
Table 1: Hospital admissions with covid in under 18 year olds according to data collected by Co-CIN / ISARIC4C for government
Intensive Care admissions
The children least likely to have an intensive care stay were those who had covid like symptoms – Type A2, For those with type A1 admissions (admissions coded as caused by covid) 3.2%were admitted to intensive care with a median stay of 2 days. Interestingly, these figures were identical to the group with an incidental covid diagnosis. The implication is that whether or not a doctor decided that a positive test result reflected the reason for admission, this did not impact on intensive care rates.
An audit of paediatric intensive care in England (PICA-net) reported 714 children (under 16) admitted to intensive care between 14th March 2020 and 31st January 2022 who “may not primarily be in PICU because of COVID-19 but all tested positive to SARS-CoV-2 either prior to or during their PICU admission.” A significant proportion of these admissions were prior to 1st July 2020 (see figure 7). The authors of the BMJ paper, however, reported 1,175 intensive care admissions for children under 18 years (excluding PIMS) admitted to intensive care between 1st July 2020 and 22nd February 2022. This is a massive discrepancy that illustrates how broadly the authors were defining “covid admissions”.
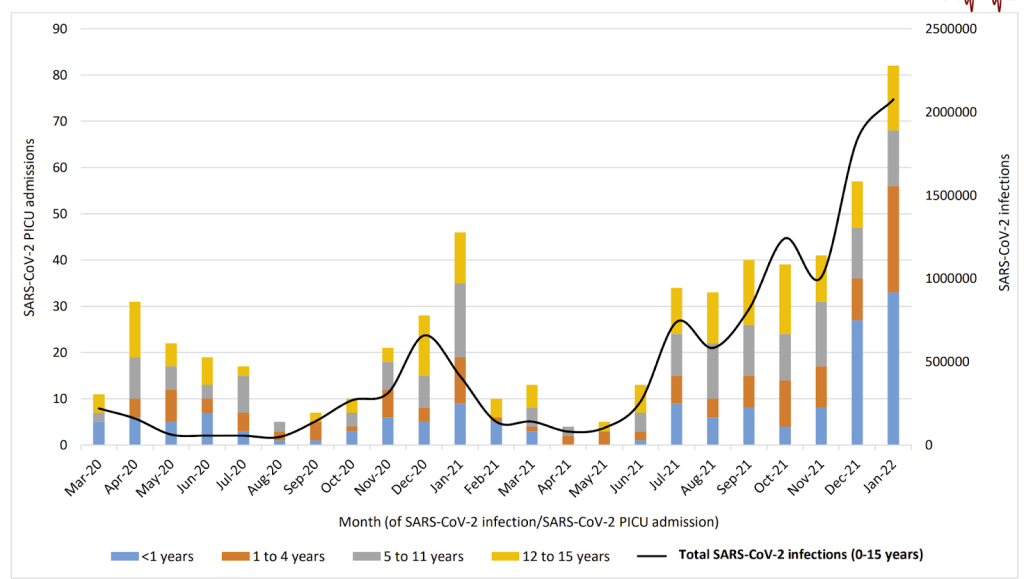
Figure 6: Paediatric intensive care audit (PICA-net) age distribution of intensive care admissions with a positive covid test as coloured bars and left axis and total community infections as black line and right axis.
The PICA-net audit also shows how closely “positive test” intensive care admissions follow infection numbers (implied by positive tests) in the community (remember that testing – the black line – was low in the community prior to July 2020). When an airborne infection passes through the community of course a proportion of those sick in intensive care will also test positive. What is notable here is that the much lower risk from Omicron is not evident. That suggests the relationship is not to do with the disease itself but rather a combination of an inability to fight off viral infection among these sick children and the overall prevalence of virus in the air, regardless of the symptoms caused.
Looking more closely at those intensive care admissions coded by clinicians as primarily due to covid, there was a clear discrepancy with the Delta wave (see figure 8). If we accept testing was accurate then the proportion needing intensive care because of covid plummeted from nearly 35% with Alpha to only 8.7% with Delta. Why? Weren’t we told Delta was more of a danger to the young? Ignoring case numbers altogether would suggest that Delta did result in more intensive care admissions for covid – why did that happen during the period of vaccine rollout?
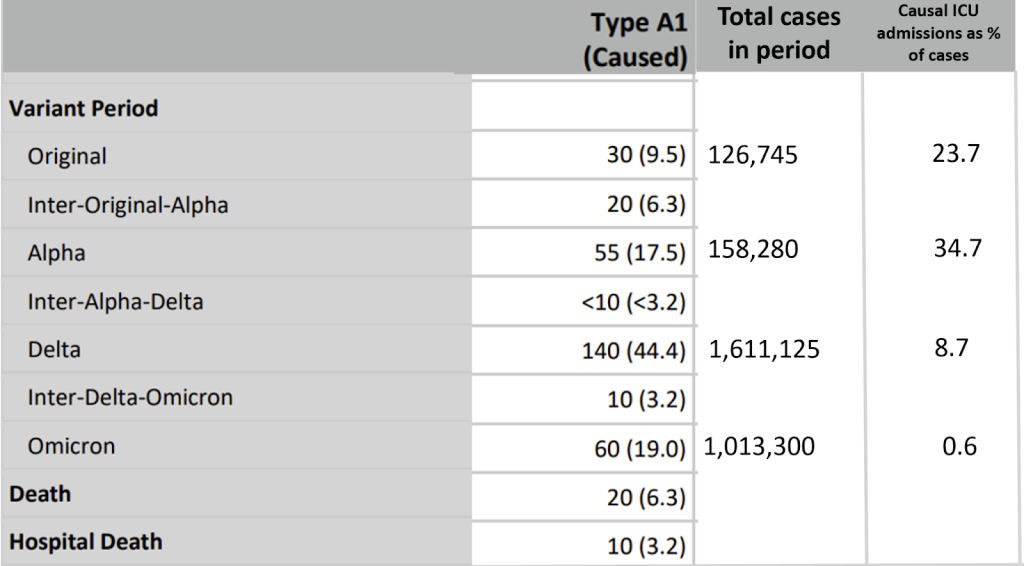
Table 2: Breakdown of time period for intensive care admissions and deaths which clinicians coded as caused by covid (derived from table C of supplementary data, table 1 of main paper and then a percentage calculated from the two)
Looking more closely still, here are the numbers of intensive care admission by age according to PICA-net.\
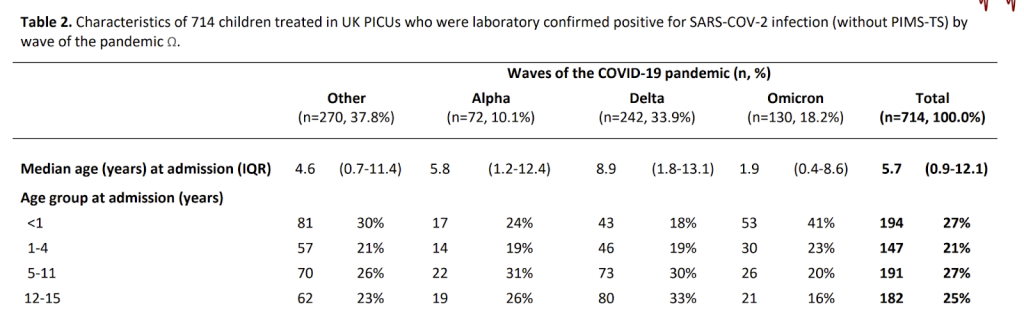
Table 3: Intensive care admissions with positive test result by age and wave (PICA-net)
The under one year olds are hard to compare because of the high risk of overdiagnosis. Looking at the 1-4 and 5-11 year olds the numbers admitted in the first wave (ie the “other” column”) and with Delta were comparable. Numbers for Alpha were about a third of that level. For the 12-15 year olds, Alpha was also about a third of the first wave (19 v 62). However, instead of Delta being comparable, during the period of vaccine rollout, intensive care admissions with a positive test were around 30% higher than for the first wave (80 vs 62).
What impact did vaccination have on intensive care admissions?
For children, the age confounding works in the opposite way to adults. It is the youngest children who are the most likely to be admitted to hospital, admitted to intensive care and to die for any reason. The difference is large. For non-covid intensive care admission 45% are under the age of 1 year. Furthermore, these children make up the majority of children who are admitted with respiratory symptoms. Therefore, grouping all the children together and then pointing out (without any qualifying commentary) that the proportion who were unvaccinated was higher among those in hospital, intensive care or among the deaths is totally disingenuous (a classic example, in fact, of a “Simpson’s paradox”). However, that is, of course, what these authors did.
(N.B. Note the very high proportion of covid admissions that were under the age of 1 year in autumn 2020. Other indicators show erroneous testing results during this period with overdiagnosis.)
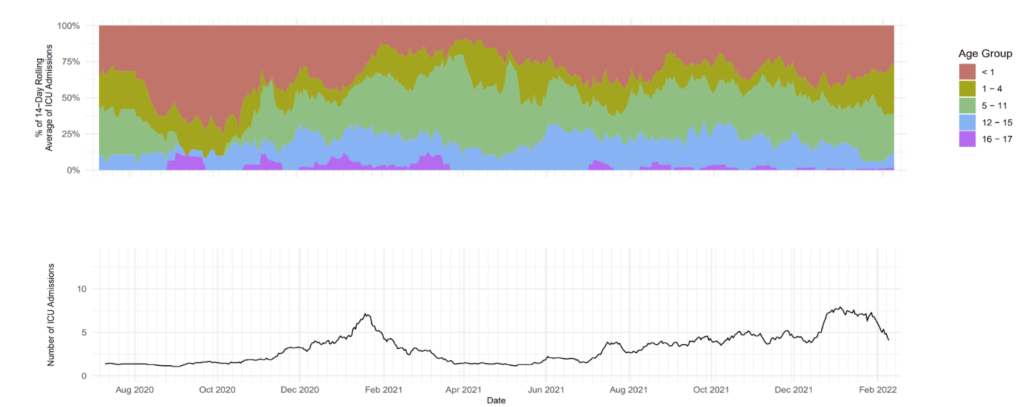
Figure 7: Age distribution of intensive care admissions by age
The authors do not report on the first two weeks after injection, and moreover they also fail to report on the number of children who were admitted to intensive care more than two weeks after their vaccination with covid. All we know is it won’t be zero.
PIMS
Rarely children have a post viral inflammatory condition, which with other viruses is called Kawasaki disease, and with covid is called PIMS. PIMS is very similar to Kawasaki except that it affects slightly older children. The rates of Kawasaki disease reported halved during the covid era in the USA. It does seem that some, if not all PIMS replaced Kawasaki disease.
PIMS is another measure of disease caused by covid in children. As a proportion of cases PIMS became insignificant with Delta. However, in absolute numbers, there were 230 admissions in the first wave, 425 for Alpha, 725 for Delta and 200 for Omicron. What should we conclude from this? Was Delta far less dangerous, if so why? Are we actually measuring a small proportion of children at risk from such syndromes and observing different levels of triggering with different viruses? What is clear, however, is that the incidence of PIMS fell dramatically with Omicron.
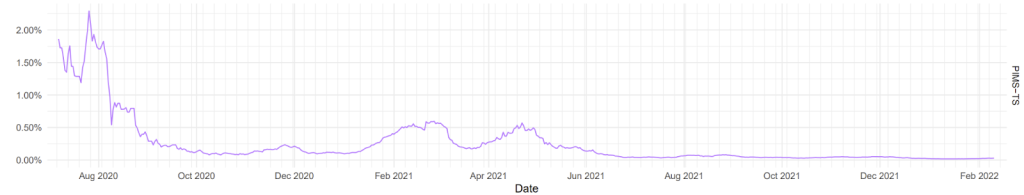
Figure 8: Children hospitalised with PIMS over time as a percentage of cases diagnosed
Deaths
The authors present a total of 70 deaths with covid and only 5 of them did not have a “medical and developmental underlying health condition.” However, looking back at figure 8 only 20 deaths were coded as primarily caused by covid and of these only half died in hospital. This begs the question as to whether the other children did not receive the care they needed before dying (which surely would have been a scandal keenly reported in mainstream media) or whether these children had other conditions that meant an acceptance of the inevitability of their death such that care could be provided at home or in a hospice.
On deaths PICA-net said, “39 children (5%) in the COVID-19 only cohort died whilst on PICU. Mortality was roughly consistent across the waves. It is possible that the cause of death in some children is unrelated to SARS-CoV-2 infection. Where children died during the Omicron wave (n=6), fewer than three deaths were recorded as being related to COVID-19.”
Going back over PICA-net reports, we can deduce the deaths per wave for children under 16 in intensive care, as shown in the table. Again there is a huge signal whereby the mortality rate almost doubled during the period of vaccination rollout (ie during Delta).
| First wave | Alpha | Delta | Omicron | |
| Deaths on ICU | 7 | 4 | 23 | 6 |
| Total admissions to ICU | 270 | 72 | 242 | 130 |
| % who died | 2.6% | 5.6% | 9.5% | 4.6% |
Table 4: Mortality rate for children on intensive care with a positive diagnosis according to PICA-net data
Conclusion
Let’s return to the premise of what the authors wanted to say and see how they performed:
- Covid caused immense harm to children
They did their best to make covid look harmful to children but it does not take long to see how they have massively exaggerated that harm.
- Vaccinated children did not get sick with covid
They did manage to show low intensive care admission for children more than two weeks after vaccination, but hid the data for admission in the first two weeks after vaccination. However, no data at all was shared on total hospital admissions by vaccination status.
- Vaccinated children did not go on to get the post covid immune syndrome PIMS
No data was shared on the vaccination status of the children with PIMS.
- Vaccinated children did not die with / of covid
No data was shared on the vaccination status of deaths with covid.The overriding conclusion has to be that the authors did not like what the data showed.
The BMJ should be ashamed to have published such a biased piece. They should ask the authors to revise the paper urgently to include the first 2 weeks after vaccination and to look at the vaccination status of PIMS cases and of ‘covid deaths’.
