

Global mortality trends in the year gone by
As 2021 draws to a close, HART looks back at the year that has passed and asks how mortality trends in 2021 compare to 2020.
How did 2021 compare to 2020? Comparing case numbers is pointless as testing has increased massively across the world meaning more positives will have been identified, including false positives. In the UK, in the first 23 days of December 2020, 8.4 million tests were carried out. One test for every 8 people in the country. These led to 506,000 positive results. For the same period in 2021, 30.2 million have been carried out or enough for nearly half the population to have been tested. With a false positive rate of 0.8% there would have been 241,000 false positive test results in that time. With testing levels that high, case numbers are bound to be astronomical.
Increased test numbers will also, inevitably, have an impact on covid death numbers. Any doctor asked to write a death certificate is bound to feel under pressure to include covid if the patient’s death has already been coded as a covid death by the Government thanks to the “within 28 days definition.” Nevertheless covid deaths are a better marker of the disease than covid cases.
However, overall excess deaths is the most important measure in terms of public health impact, and therefore this review reports first on worldwide covid deaths and then on excess deaths by country.
Compared to 2020, this year we have:
- Fewer susceptible vulnerable people in the population as many died already in 2020
- More people with naturally acquired immunity
- A heavily vaccinated population
Therefore, it might have been reasonable to expect fewer deaths.
Worldwide Covid Deaths
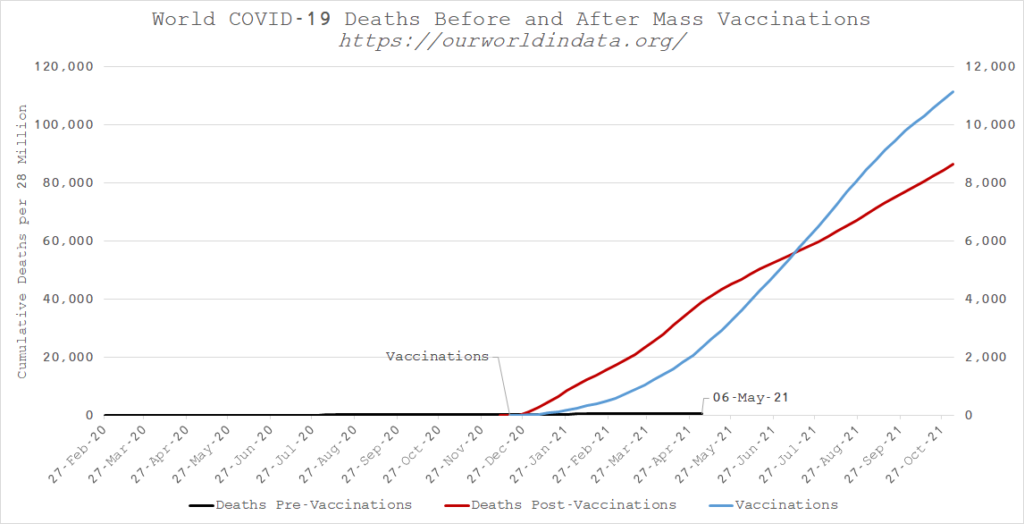
Rather than compare from January 1st, let’s compare from the date when vaccines rollout began in each country. The data from 131 countries with a population over 1 million and covid deaths more than 50 per million, has been collated. Figure 1 shows cumulative deaths, so the line can only climb and will plateau when there are no deaths. The red line, for 2021, after vaccine rollout, is steeper than the black line for 2020, which is odd.
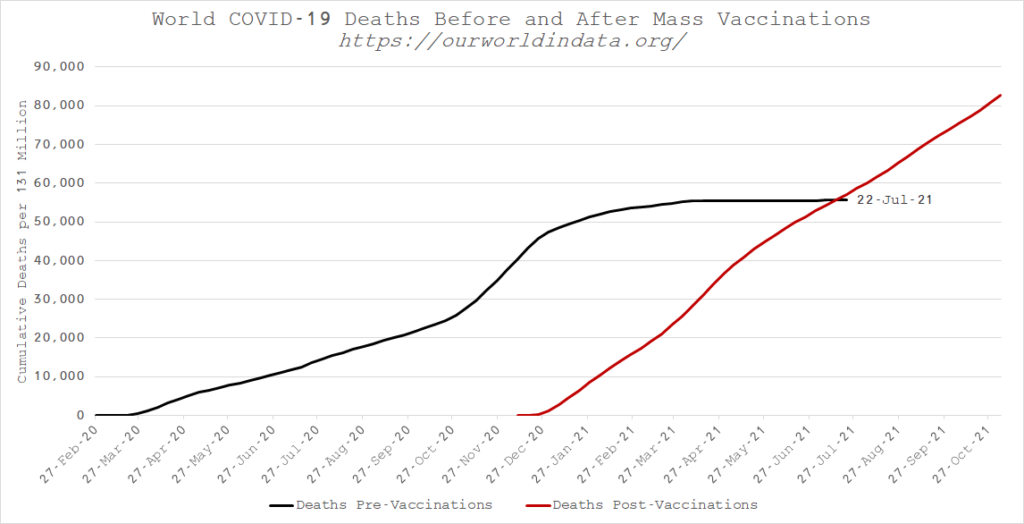
By 22nd July 2021, all 131 countries had begun their vaccine rollout. Comparing the period from the point when every country had started vaccinating with the same period in 2020 shows clearly that post vaccine deaths accumulated faster than pre-vaccination deaths.
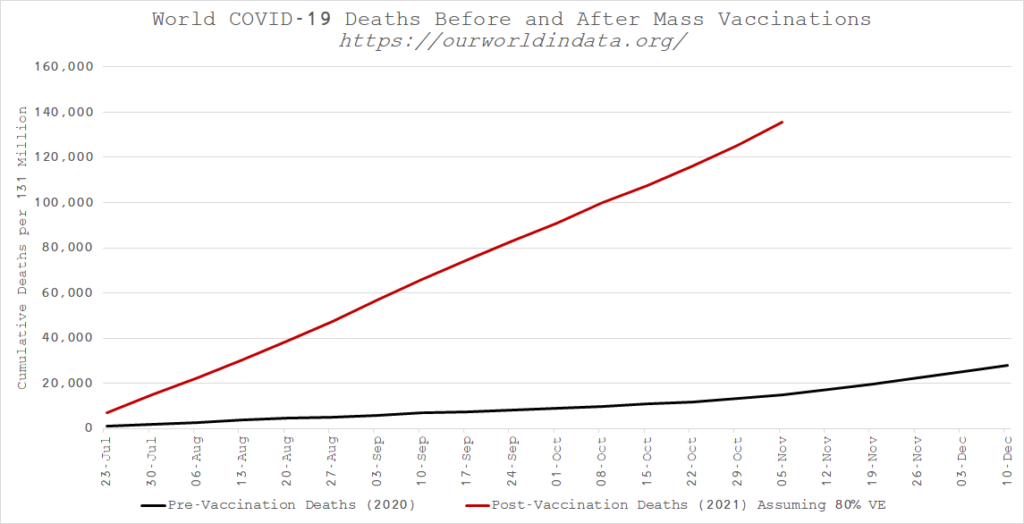
The claim has been made that the vaccines have 80% efficacy against death. Therefore, if they are working as advertised, we can plot the number of deaths there would have been had there been no vaccination. Figure 3 shows the massively steep accumulation of deaths in the red line that there would have had to have been in order to make the claim of 80% vaccine efficacy. The line is so much steeper than the pre-vaccination rates that it is not credible.
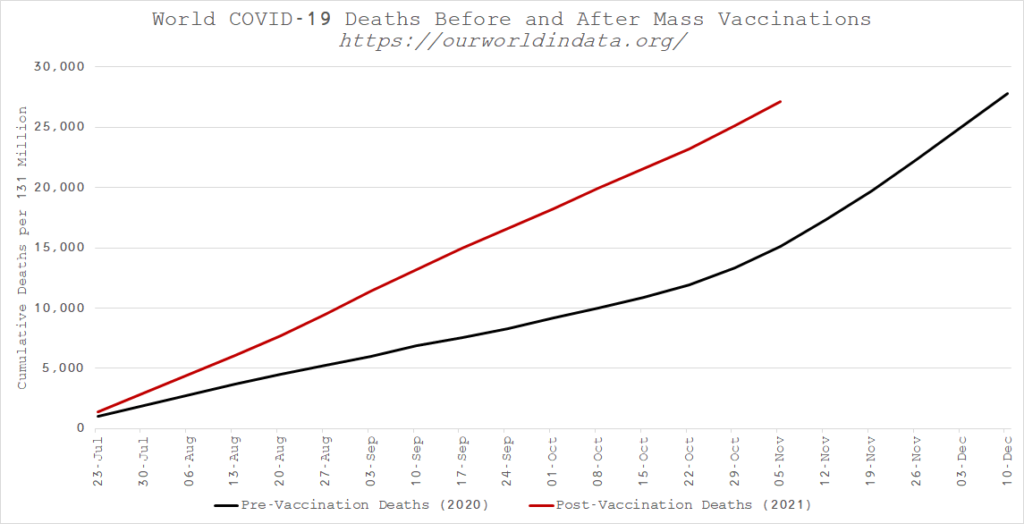
Of the 131 countries in this cohort, there are 28 where there were no covid deaths at all prior to vaccination. Collating the death data from these countries before and after vaccination results in the cumulative death chart shown in figure 4.
Excess mortality by country
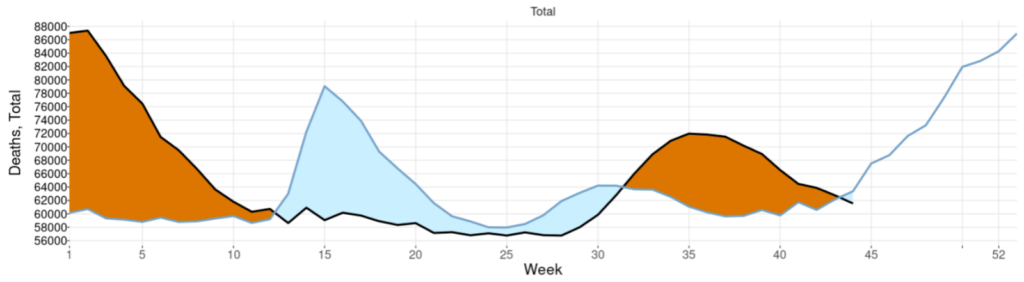
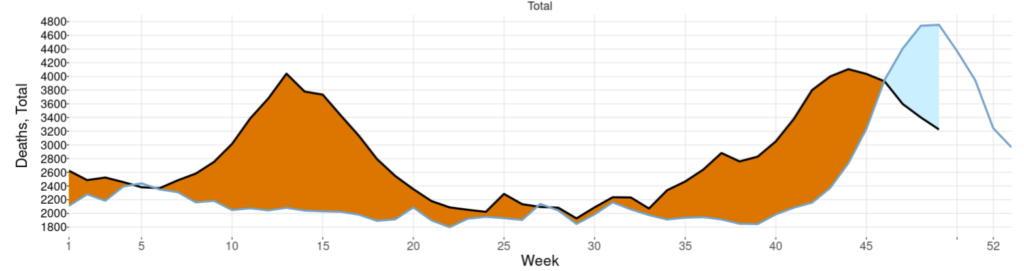
Covid death counts do overestimate deaths due to covid, because in many cases the finding of viral fragments by extremely sensitive testing is an incidental finding. It is therefore worth comparing excess mortality for 2020 compared to 2021. Covid is not the only cause of excess mortality and lack of access to healthcare services, staff shortages due to isolation and psychological stressors from the fear propaganda will all have contributed too. The United States has seen higher levels of excess deaths this autumn than last year: Figure 5 shows total deaths in 2020 in light blue with total deaths in 2021 in black. The 2021 autumn death wave arrived later but has been larger:
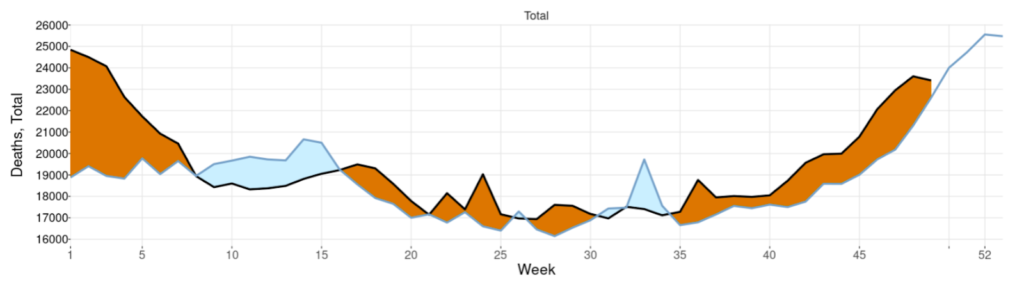
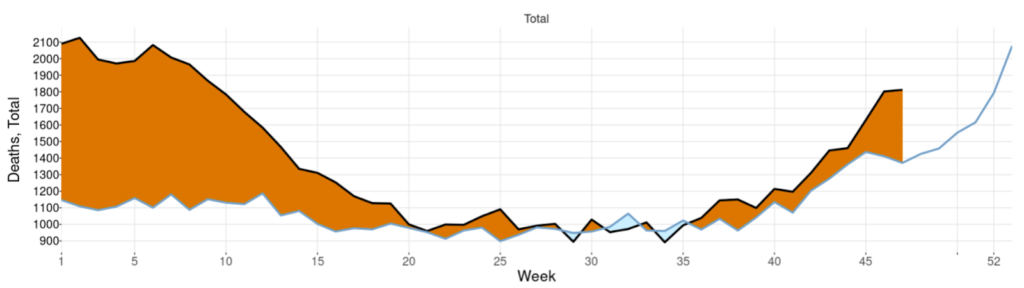
In contrast the same graph for Germany, Netherlands, Norway, Bulgaria and Slovakia show the autumn wave arriving earlier this year but again causing more deaths.
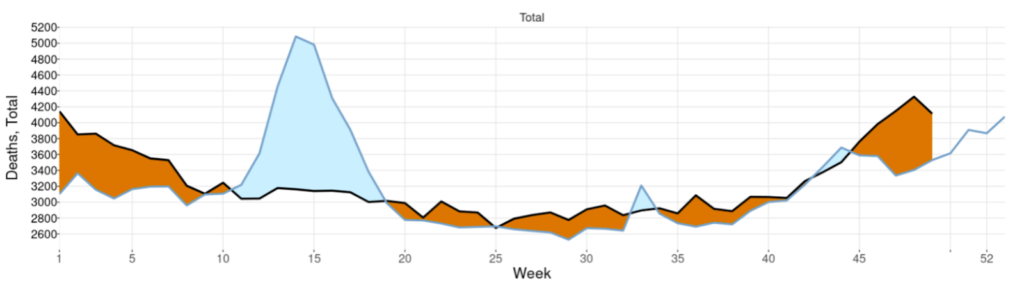
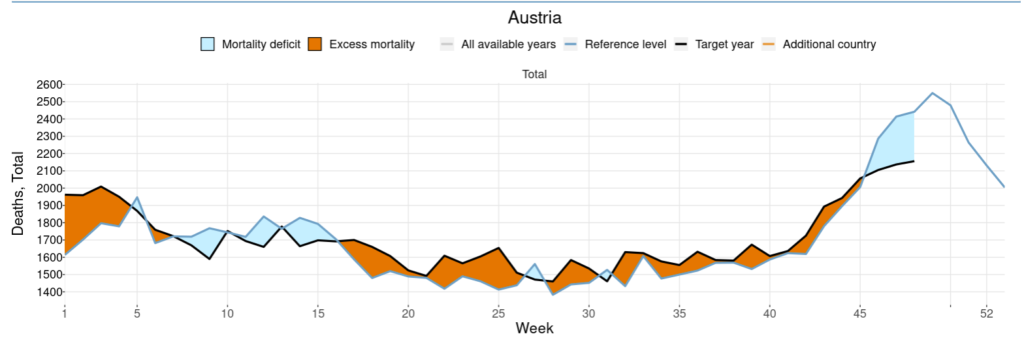
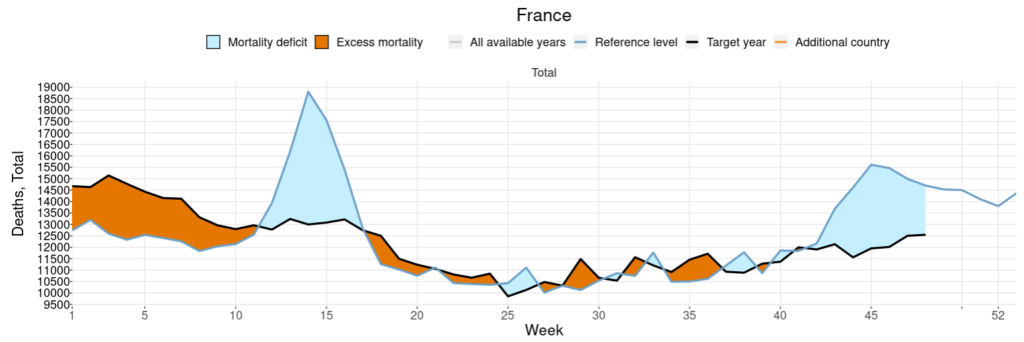
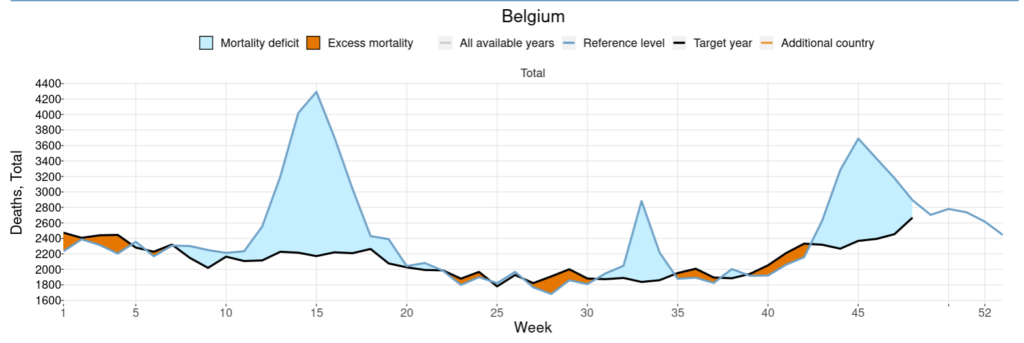
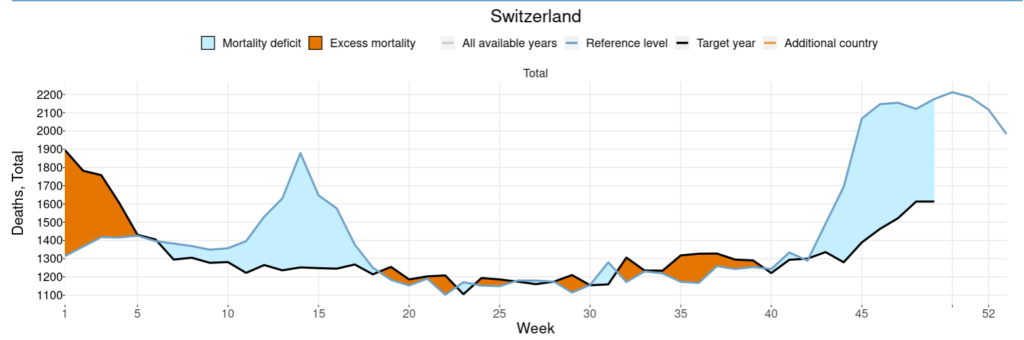
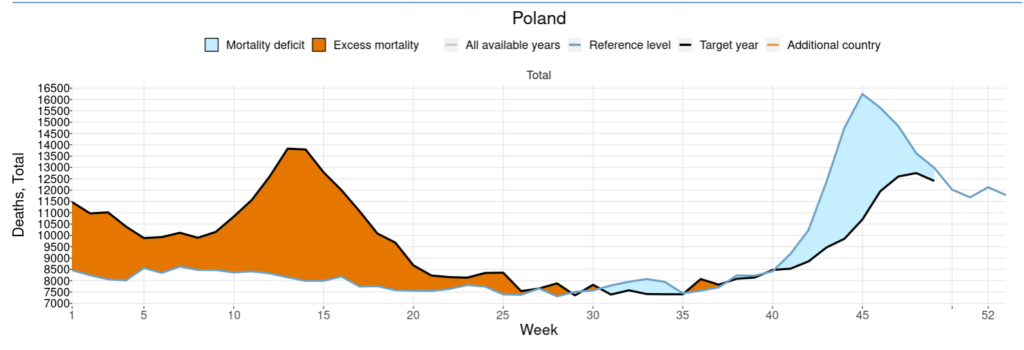
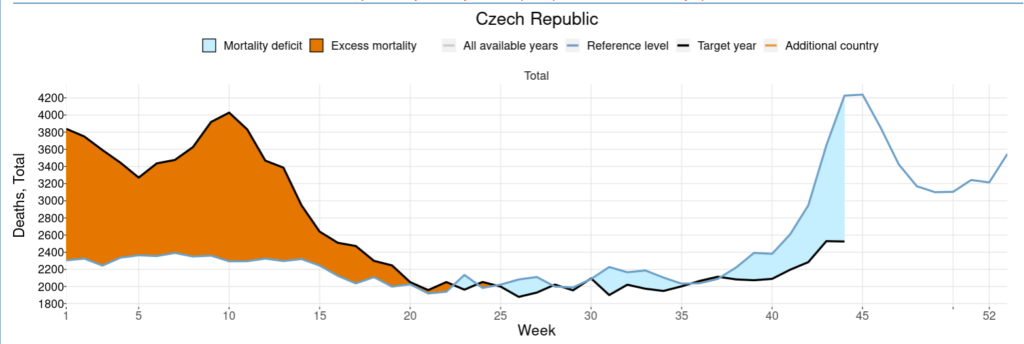
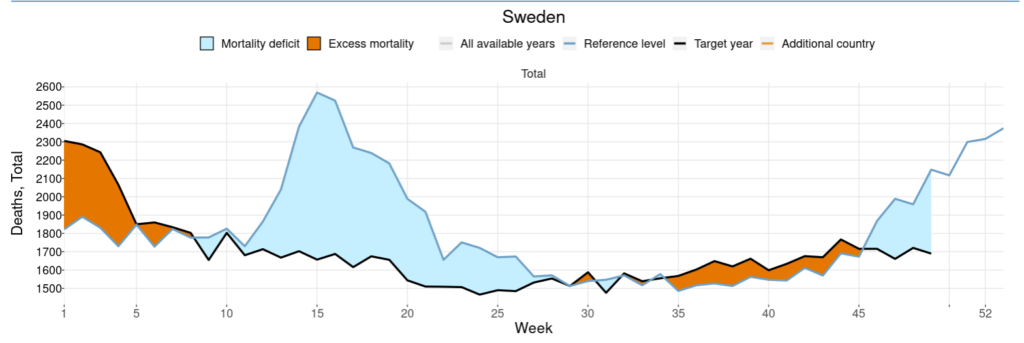
Austria, France, Belgium, Switzerland, Poland, Hungary, Czech Republic and Sweden have all had lower deaths than last year:

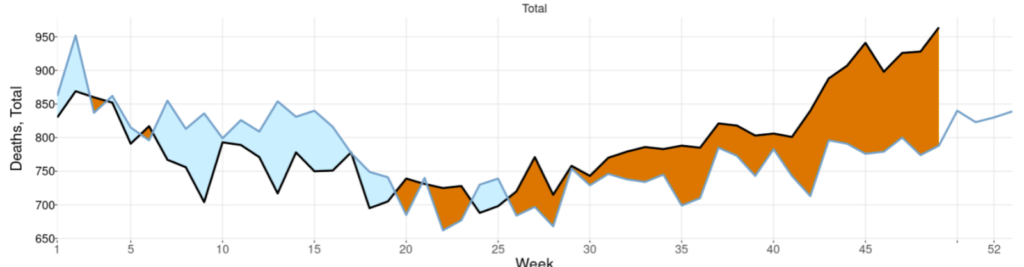
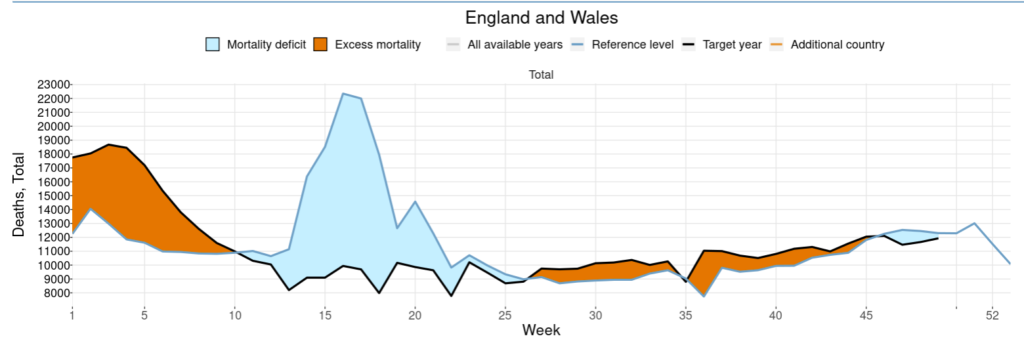
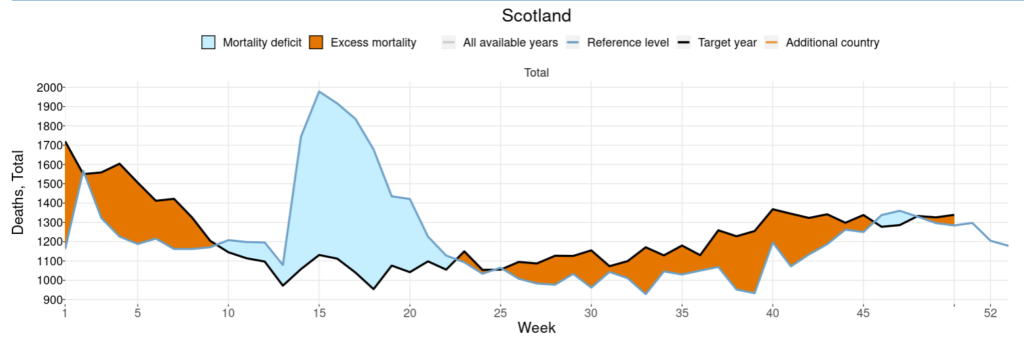
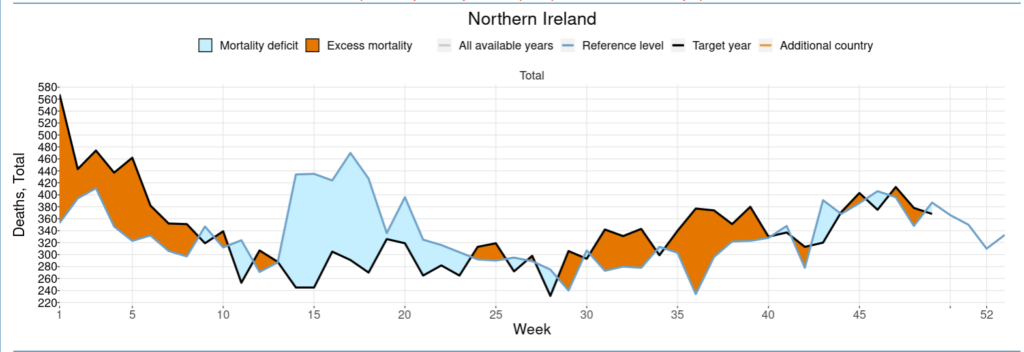
England, Wales, Scotland and Northern Ireland have shown higher death levels through the summer but lower or similar levels more recently:
Conclusion
The expected lower mortality from the most vulnerable having already died, increased levels of natural immunity and vaccination are not evident in many countries. The seasonal rises in mortality show a similar pattern to that seen previously with influenza with waves arriving earlier or later in different places but the magnitude being similar each winter. Whether the countries that appear to have fewer deaths currently are having a later wave than last year or genuinely have fewer deaths will be evident in the next month.
