
How much recent excess is an illusion?
There is much confusion about excess deaths currently with different government bodies contradicting each other about the extent of the problem. The ONS use a baseline which includes 2017, 2018, 2019, 2021 and 2022 as years with which to calculate expected deaths. Despite this clearly elevated “normal” they have reported excess mortality for most weeks of this year.
In contrast, UKHSA produces a weekly mortality report which claims there have only been excess deaths among adults in weeks 2 and 3, with every other week being at expected levels. They do not disclose how they calculate a baseline.
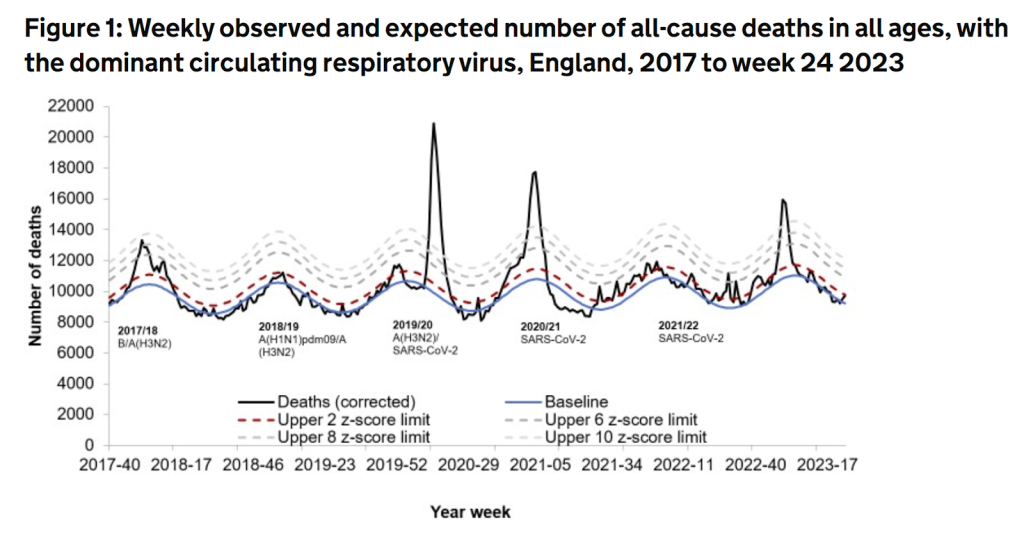
Figure 1: UKHSA data on weekly observed and expected deaths
On the other hand, The Office for Health Improvement and Disparities (part of the Department for Health and Social Care) have reported excess mortality for all but two weeks of 2023. Their baseline is modelled using data from 2015-2019 taking into account trends over time and the changing structure of the population.
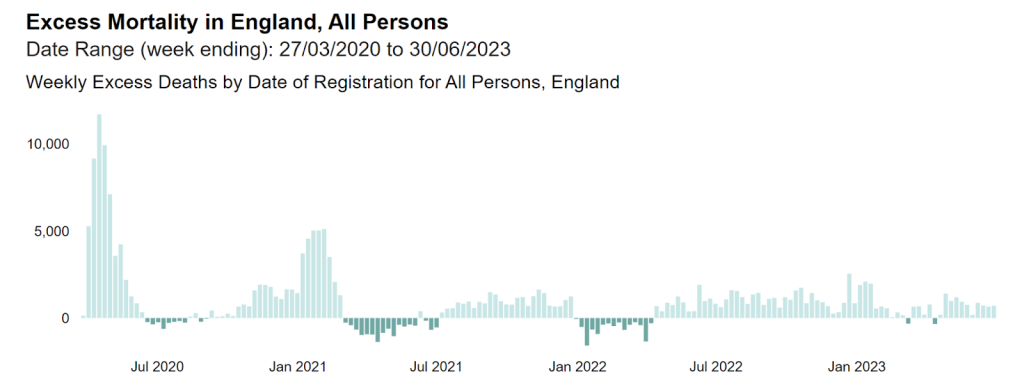
Figure 2: OHID data on total excess deaths
Why are there these discrepancies?
Aside from differences in the baseline, the other key answer is that UKHSA is using estimated deaths by date of occurrence whereas the ONS and The Office for Health Improvement and Disparities (OHID) are using deaths registered each week.
Normally, half way through the year, deaths by date of registration exceed deaths by date of occurrence by about 2%. This is partly because of underestimates in the death by date of occurrence data but it is also because of deaths that occurred at the end of the preceding year that had their registrations postponed because of Christmas and New Year. For 2023, this discrepancy is twice as large. There are 4% more deaths by date of registration than by date of occurrence.
Over the course of a whole year, deaths by date of registration usually exceed the total estimated deaths by date of occurrence by 1.5-1.8%, but in 2022 there were fewer deaths by registration than estimated deaths by date of occurrence. That discrepancy was bumped into 2023 and added to the 2023 total.
After a period of high numbers of excess deaths as we saw in 2020, 2021 and 2022, it is reasonable to expect a lack of excess.
There is indeed a lack of excess in some disease categories e.g. Alzheimers, and Parkinson’s disease.
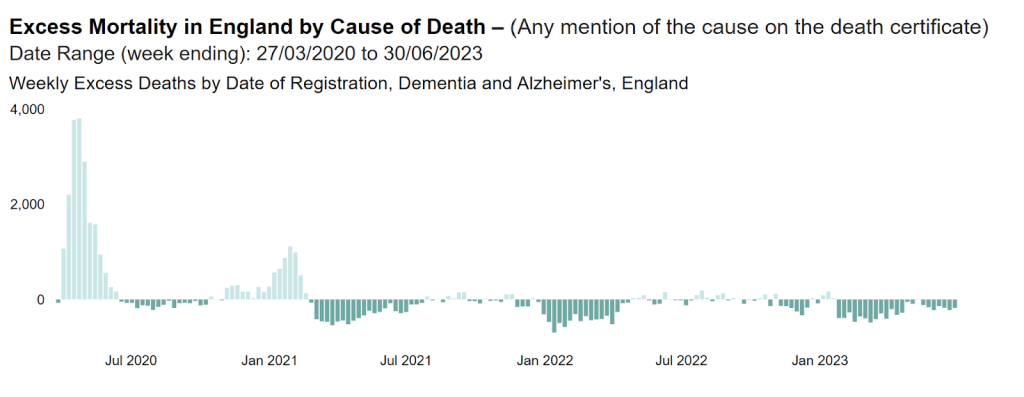
Figure 3: OHID data on deaths from Dementia and Alzheimer’s
There has also been an overall deficit in the number of care home deaths.
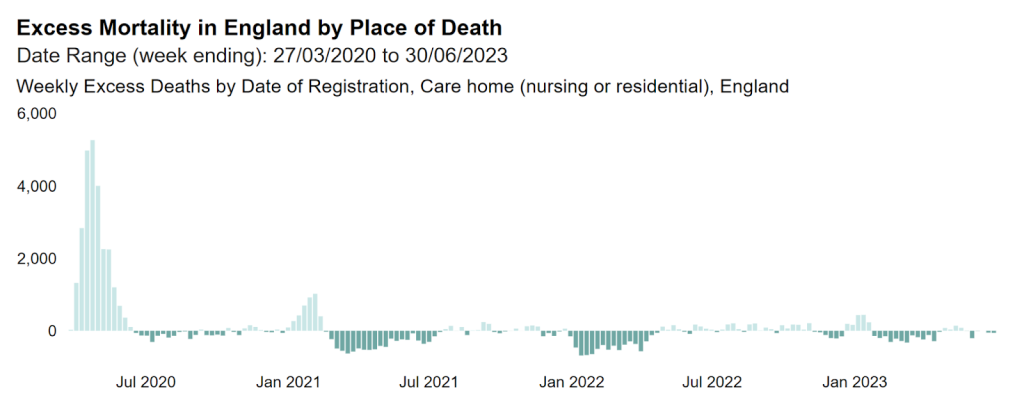
Figure 4: OHID data on deaths in care homes
In contrast, younger age groups have shown significant excess that has not been caused by covid. The size of the population in this age group increased from 19,452,300 in the 2011 census to 19,576,710 in 2021, a 0.6% increase that would not be enough to account for the extra 1081 deaths seen in 2023 alone.
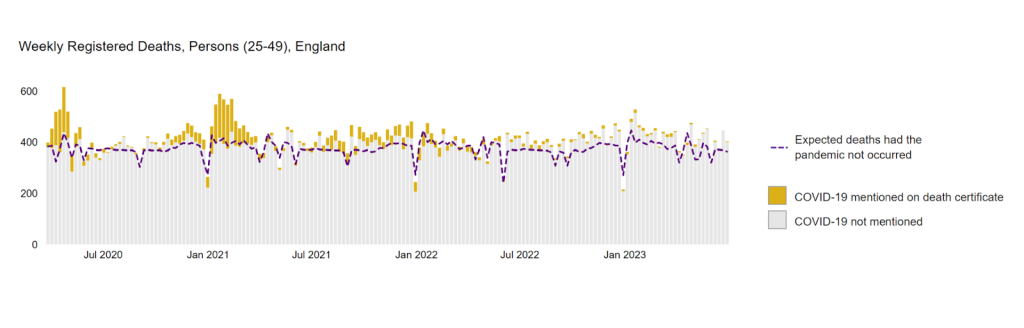
Figure 5: OHID data on deaths among 25-49 year olds with covid attributed deaths in yellow
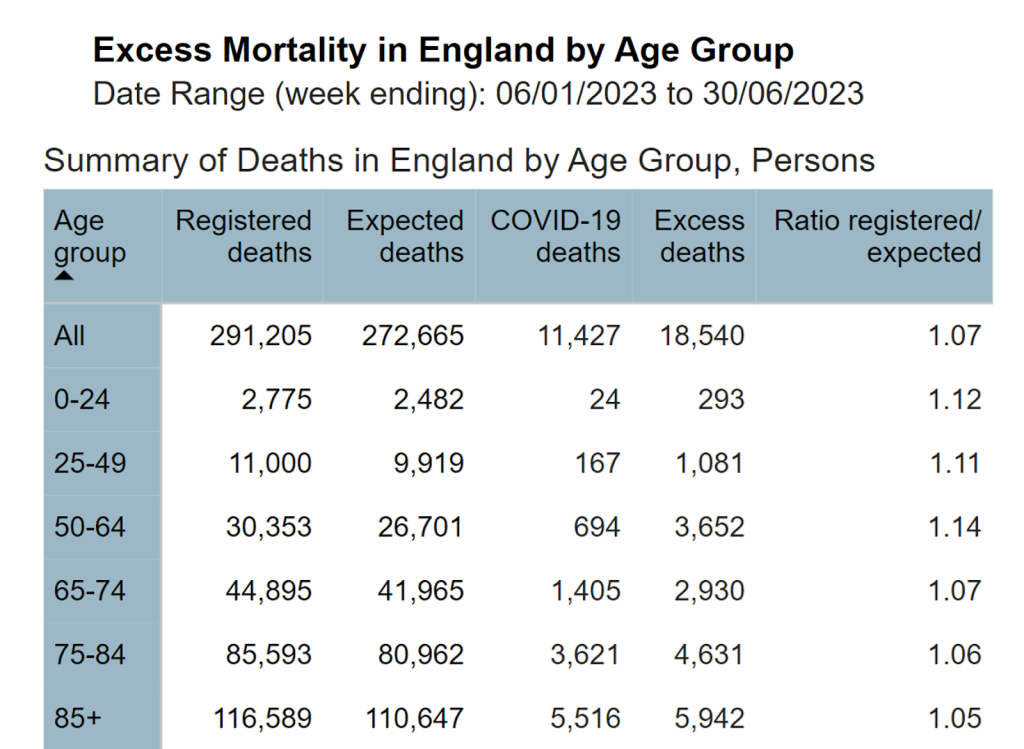
Figure 6: OHID data showing deaths in 2023 with the last column showing an 11% rise in deaths among 25-49 year olds and 14% among people aged 50-64 years.
It is important to acknowledge that the overall death by date of occurrence data is not showing the same number of deaths as registration death data. However, there remain reasons to be concerned: there ought to be a death deficit and the excess deaths that we are seeing are affecting young people and are not evenly distributed across all causes.
