
Recent fantasy claims about deaths prevented
Original Imperial College analysis here.
Imperial College has a terrible track record of presenting modelled data as if it was scientific evidence based on more than just biased assumptions. Imperial was responsible for the fantasy claim that covid would cause 510,000 deaths in the UK without changes to human behaviour. That claim was based on the idea of a covid tsunami that would infect 85% of the population unless there was a reduction in close contacts. After numerous waves have been observed to peak independently of changes in human behaviour, that claim has still not been modified. Subsequently they claimed 20 million lives were saved, a fantasy scenario dependent on there having been half a million lives saved in the UK alone. Now they are trying for a hat-trick with more erroneous claims on lives saved by the vaccine.
Their latest claim is that a median of 10,100 lives were saved by ensuring as many people as possible were given a first dose and delaying the second dose. They said that between 8 December 2020 and 13 September 2021 “Delaying people’s second COVID-19 vaccine dose likely prevented tens of thousands of hospitalisations and thousands of deaths in England.” Whilst this claims to be a retrospective study, it doesn’t address how the study figures relate to the real world data.
In reality, there was huge disappointment about the efficacy of the first dose. The Pfizer trial had shown an apparently miraculous flattening of the symptomatic infection curve after only 12 days from the first dose.
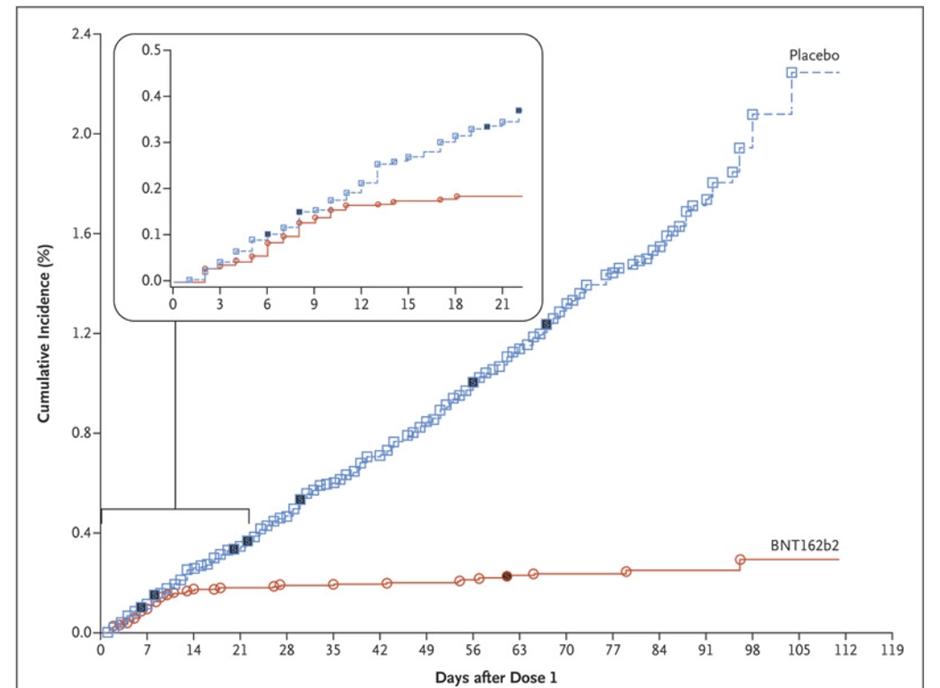
Yet numerous people witnessed the lack of efficacy of one dose in real life and called for second doses to be prioritised in order to provide protection to the most vulnerable, who in their view, were clearly not protected by the first dose.
Professor Martin Vernon, a consultant geriatrician in Greater Manchester, said he was “deeply concerned” by infection outbreaks “within, and beyond 21 days of vaccination”. The Chair of the BMA said, “The other worry is that members of the population, those who are at highest risk, may not be protected.”
Imperial claims to have found that vaccinating with a 12 week interval would have prevented a median of 58,000 hospitalisations and 10,100 deaths compared to the 3 week interval.
The modelling done here was based on assumptions that were so far removed from reality that we can easily use reality to show they were wrong.
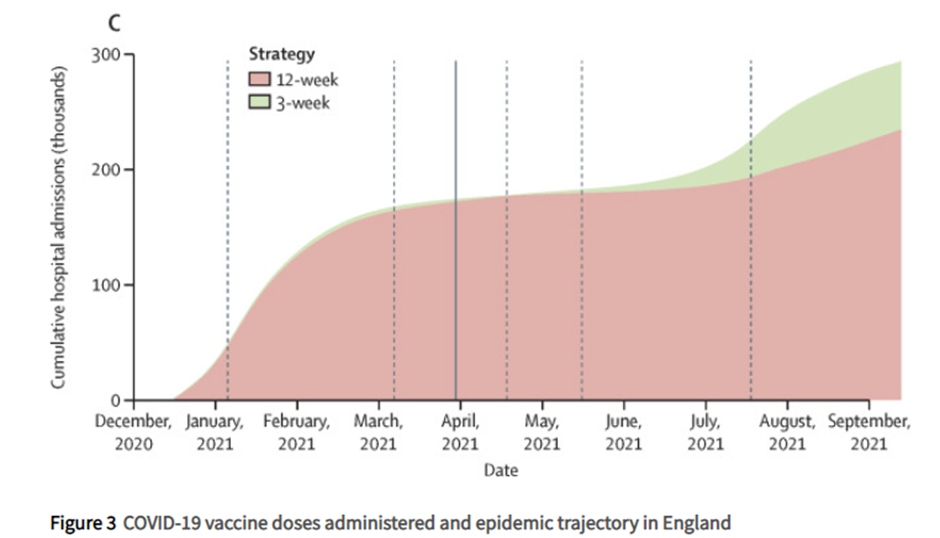
Figure 1: Cumulative hospitalisations by different modelled Imperial scenarios
This graph shows their claim for the difference in hospitalisation numbers based on their two different strategies. It is remarkable that they claim minimal difference at all until the summer. At that point the majority of those who were at risk of hospitalisation with covid had been vaccinated long ago.
Looking first at deaths that occurred up to 13th September 2020, in England, the modelling study claimed that with a 3 week interval there would have been 64,800 deaths (with a 95% confidence that the number would be between 60,200 and 68,900). With the extended 12 week delay between doses, they claimed there would have been 54,700 deaths (with a 95% confidence that the number would be between 52,800 and 55,600).
They give their estimates for the different models in their supplementary appendix on page 70. Looking only at death figures, we can see the difference between the claimed figures in their model and reality. The final column shows the actual numbers of deaths in England from the government’s covid dashboard for the same period.
The three week claim is purely fantasy, but the 12 week interval was actual policy. Yet, here Imperial are claiming that the 12 week scenario would have resulted in thousands fewer deaths than actually occurred. It is not only their mean estimate that is lower than what happened in reality, but even the upper confidence estimate.
| Scenario | Lower confidence interval | Mean | Upper Confidence interval | Dashboard data | |
| 21/06/2021 | |||||
| 3-week vaccine interval | 44,900 | 48,800 | 52,900 | 63,861 | |
| 12-week vaccine interval | 45,400 | 47,400 | 48,100 | ||
| 19/07/2021 | |||||
| 3-week vaccine interval | 48,900 | 52,900 | 56,900 | 64,705 | |
| 12-week vaccine interval | 46,600 | 48,500 | 49,300 | ||
| 13/09/2021 | |||||
| 3-week vaccine interval | 60,200 | 64,800 | 68,900 | 69,772 | |
| 12-week vaccine interval | 52,800 | 54,700 | 55,600 | ||
Perhaps the death figures in this study were only hospital/institutional deaths? However, the details of the modelling in Supplementary Appendix 1 clearly show that deaths in all localities were included. There is no evidence provided of the applicability of the model with respect to overall deaths.
Finally, they include graphs for hospital deaths only, in Figure S11, which are so small that it is difficult to see the detail. It is impossible to see where the real data points are in relation to the model. Zooming in reveals some questionable presentation of the data.
The size of individual data points (brown) obscures the modelling (blue line with light blue confidence areas above and below). Notice that for both of these particular charts the upper data point is cropped at the top. Also it is unclear why these charts are showing figures from before December 2020. Perhaps included in an attempt to justify the modelling.
The recent claims made by Imperial College London regarding the impact of delaying second vaccine doses on hospitalizations and deaths in England appear to be far removed from the reality observed during the study period. The discrepancies between the modelled data and actual figures cast doubt on the reliability of the conclusions reached. It is essential that we remain critical of such claims and focus on scrutinising the data and assumptions used in these models. After all, public health policy should be informed by accurate and evidence-based information.
