
Effects of boosters and of vaccinations in schools
HART have previously reported on the evidence of increased covid infection rates in the first two weeks after the first dose of vaccine. With the Government pushing to maximise booster doses it is also important for us to understand whether a similar effect is seen after booster vaccination. Research on covid after boosters has followed the familiar — and highly dubious — pattern of making sure any negative effect in the first two weeks isincluded in the control group. Pfizer’s submission to the FDA for approval of the boosters included the line:
“Individuals initially belonged to the ‘non-booster’ cohort and entered the ‘booster’ cohort 12 days after receiving a third dose of BNT162b2.”
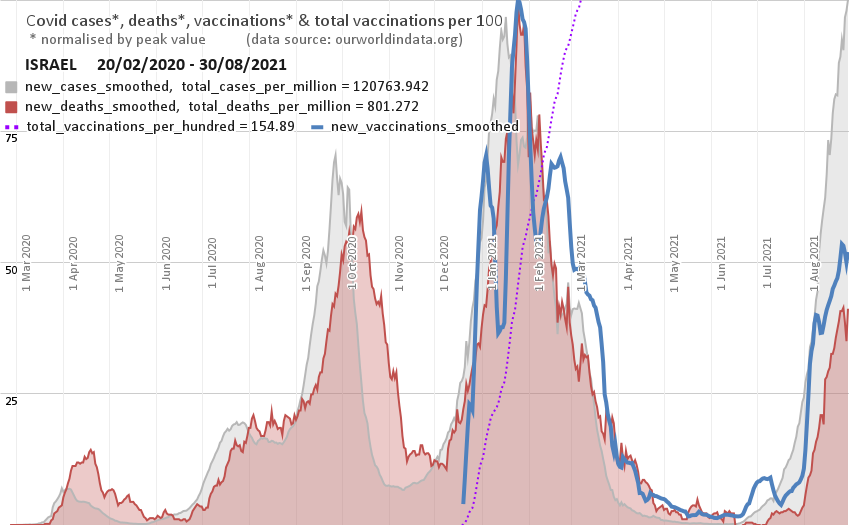
As part of the study 34 out of 268 of the participants were excluded because of “evidence of infection up to 1 month after booster dose.” This included those who had antibodies from previous infections and those who tested PCR positive over the course of the first month after booster vaccine. It is unclear how many were excluded because of an infection before the booster and how many had an infection in the first month. However, the fact they felt the need to be ambiguous about this should ring alarm bells. Given all we know about the higher covid death rates after first doses, should we just dismiss as coincidence the exact correlation between booster doses and cases seen in Israel this autumn? Nowhere have they published how many people were infected in the first 12 days after the booster. This is critical information that is required to understand the safety and efficacy of these vaccines.
UKHSA have published the latest data on the impact of vaccination in schools. The study showed that 12-15 year olds were 25% more likely to catch covid than their unvaccinated counterparts for a full 9 days after vaccination (supplementary table 5). Given that covid is an infectious disease, this higher rate of infection will have resulted in spread and cases among other children.
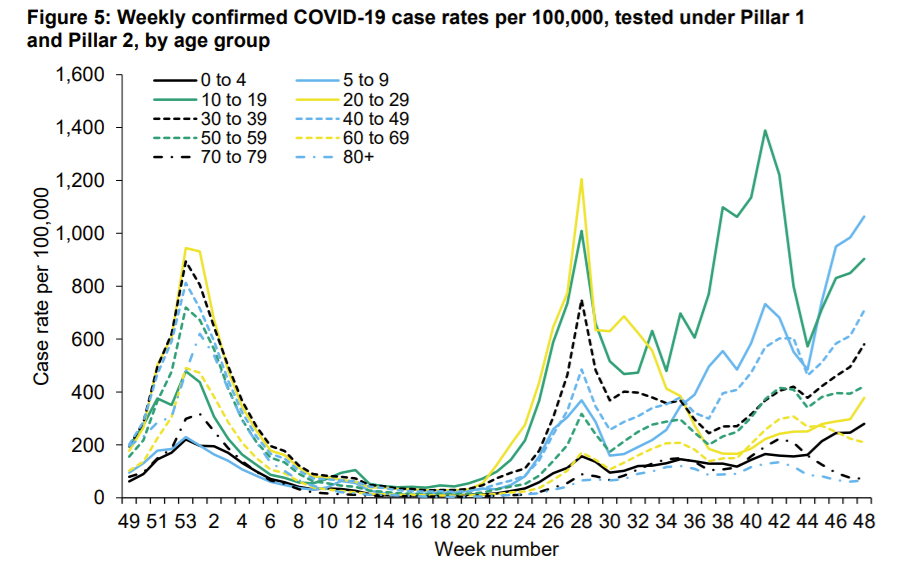
UKHSA have published a graph showing when the rise in cases in school aged children occurred. They have marked on the graph the date at which each age group became eligible for vaccination.
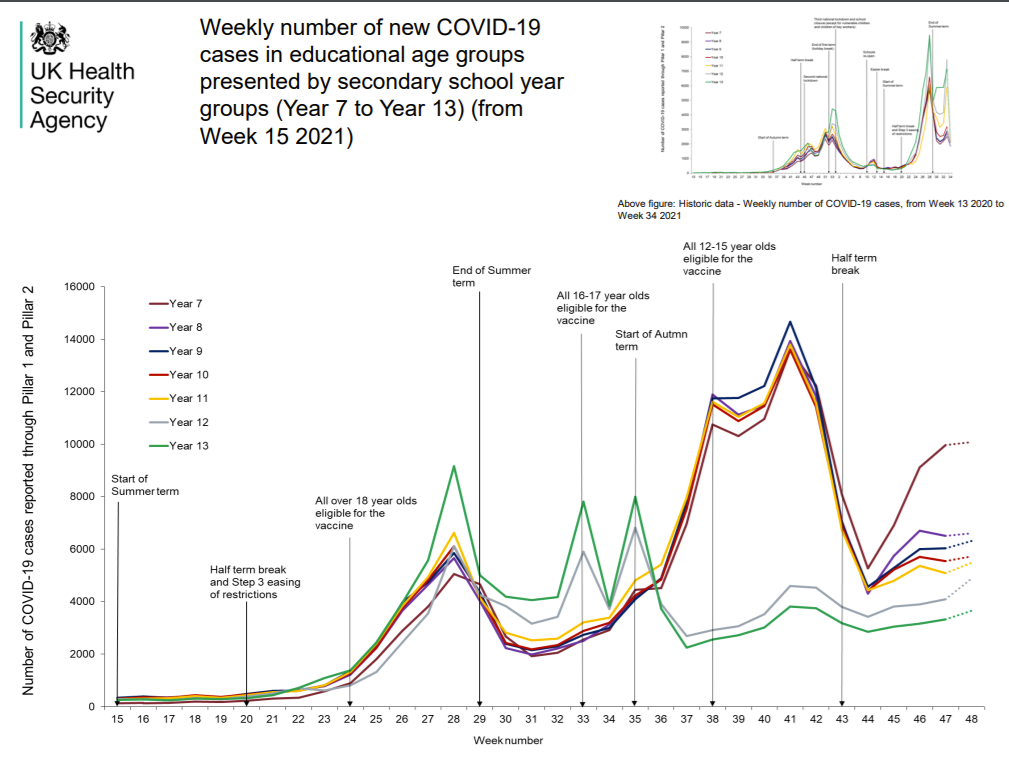
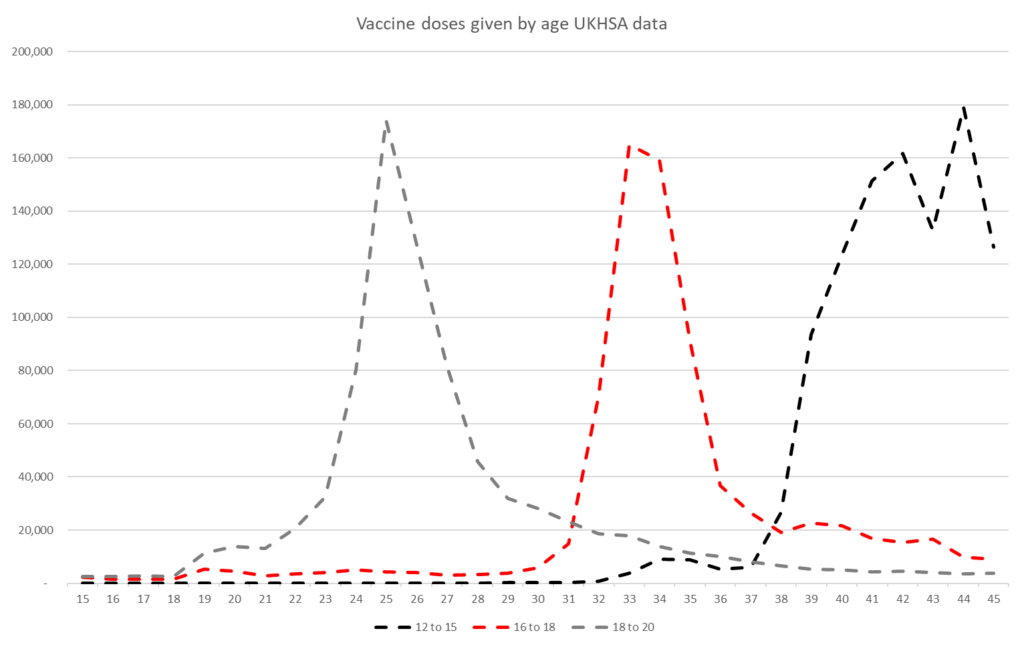
However, many children were vaccinated prior to the date at which their age group became officially eligible. As seen in figure 2.
Superimposing the two graphs shows that the rise in cases coincides with the sharp increase in vaccines given to each age group in turn.
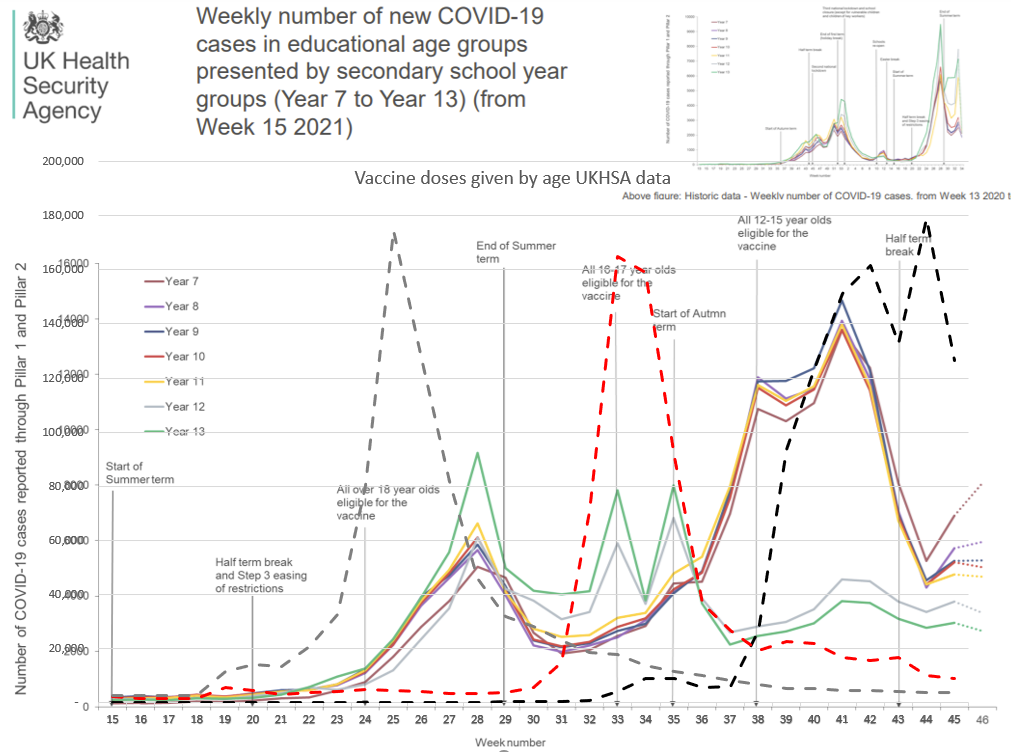
Furthermore, the rise in cases seen among vaccinated people in their 40s and younger children correlates well with when parents and families were in close contact with recently vaccinated older children.
First doses of covid vaccine lead to increased covid cases and inevitably, covid spread. The recent surges seen in schools correlate with the timing of vaccine rollout for each age group. The safety and efficacy of vaccination should not be calculated without consideration of this two week danger window. Details of the risk in the first two weeks after booster need to be urgently disclosed.
