Data presentation was deceptive
All HART articles also on Substack. Please consider a PAID SUBSCRIPTION so we can continue our work. Comments are open so you can join in the conversation.
In chemotherapy, the primary aim is to reduce the disease burden in patients who are already diagnosed with cancer. This is reflected in endpoints like tumour size reduction, progression-free survival, and overall survival, which are directly related to the degree of disease burden. Therefore, measuring the benefit of chemotherapy involves comparing the extent of disease burden (or its progression) at the end of the trial between those who received the chemotherapy and those who did not. This comparison provides insight into how effectively the chemotherapy mitigates the impact of the cancer.
On the other hand, vaccines are designed with the primary goal of keeping individuals healthy by preventing the onset of a specific disease. Therefore, the efficacy of vaccines is best measured by comparing the health status among participants at the end of the trial. This involves assessing how many individuals remained healthy and disease-free in the vaccinated group versus the control group. Such an approach accurately reflects the preventive nature of vaccines.
The covid vaccine trials did not focus on how many were healthy instead comparing those who developed disease. To take the Pfizer/BioNTech trial as an example, there were 8 PCR positive symptomatic people in the vaccine group and 162 in the placebo group more than a week after the second dose and after up to 2 month’s follow up. That worked out at a 94.6% efficacy when calculated as a percentage reduction.
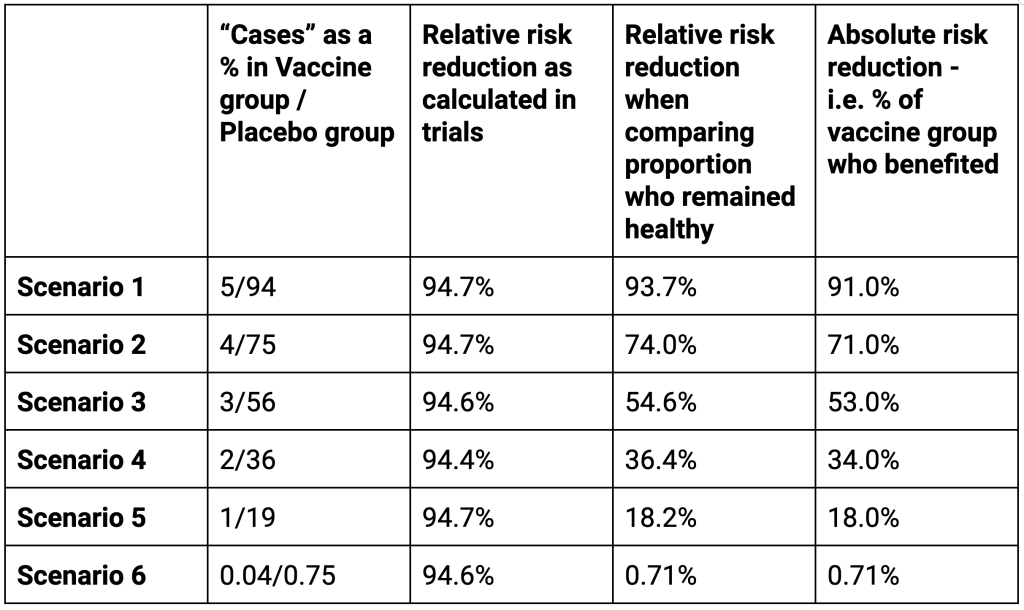
That sounds fantastic but it is not fantastic when measured in other ways. There is more than one scenario that could result in a claim of a 94.6% relative risk reduction as shown in the table. The alternative ways of measuring show the relative change in the percentage who remained healthy and the absolute change – i.e. the percentage of the population who benefitted.

In a hypothetical trial in which 94% of the placebo group developed a disease while only 5% of the treatment group did would also have a 95% efficacy as calculated the conventional way. However, these results have a totally different meaning to a patient. In this scenario 93.7% of the individuals who received the treatment directly benefited. Furthermore there was a marked change, 91.0% in the proportion who remained healthy.
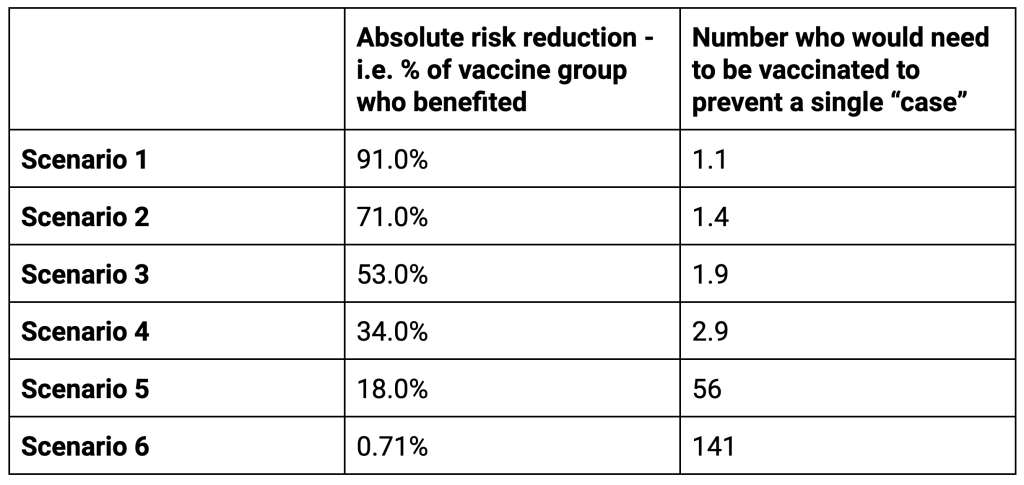
Adjusting the percentages affected shows numerous situations in which the Relative Risk Reduction as conventionally calculated are identical but the Relative Risk Reduction in the proportion remaining healthy and the proportion who directly benefited tell a very different story. The last row are the actual results.

For the first two scenarios the people taking the treatment are more likely to directly benefit than not. For scenarios 3 and 4 there is still a high possibility of direct benefit. However, for the last two scenarios the chances of not directly benefiting are far higher than the chance of benefitting. It is possible in these scenarios that a longer follow up would improve the situation as more people would develop disease or be protected from it. However, the evidence of waning means that the time frame of follow up is close to the maximum possible period of benefit anyway.The important lesson here is that looking at the relative risk reduction as presented in the trials on its own is a meaningless measure. That is why the industry’s own code of practice says, “Referring only to relative risk, especially with regard to risk reduction, can make a medicine appear more effective than it actually is. In order to assess the clinical impact of an outcome, the reader also needs to know the absolute risk involved. In that regard, relative risk should never be referred to without also referring to the absolute risk.” The efficacy claims, even if we trust the results, were presented to the public in a way that could be deliberately misinterpreted.
