

The suggestion that everyone is susceptible is a myth
In spring 2020, the rise — and then uninterrupted decay — of the Covid wave formed the shape of a classical mathematical distribution: the Gompertz curve. A Gompertz curve is characterised by a constant rate of slowing. For example, bacteria will replicate in a petri dish very rapidly at first, but as nutrients and space diminish the rate of replication will slow until no more replication is possible.
In the case of Covid, the slowing occurred because there were fewer and fewer susceptible people in the population for the virus to infect. The expectation that this could only happen when more than 60% of people had been infected was proved wrong. Prior immunity had not been accounted for and the vast majority of the population were immune to the Wuhan variant. Herd immunity for that one variant was reached when only 7% of the population had been infected and developed antibodies. Claims that we had reached herd immunity at that time were incorrect in the long term (because of the arrival of new variants), but were correct with respect to the Wuhan variant.
Subsequent variants have produced waves of similar size and duration and with a similar characteristic deceleration as the susceptible population reduces. People infected with a previous variant likely do not materially slow the spread of a subsequent variant because they are likely just bystanders, though may suffer mild symptoms and could be involved in transmission. Spread of materially symptomatic disease only occurs between the 5-15% who are susceptible..
The Gompertz distribution is not the only evidence that only 5-15% of the population are susceptible to each variant. Influenza shows similar patterns with only 5-15% of the population being susceptible to each variant (strain). Given the apparent replacement of influenza with SARS-CoV-2 since spring 2020, 2 weeks earlier in Italy than in the UK and Sweden, there may be reasons to look more closely at the influenza model.
Other evidence that supports this hypothesis includes the fact that only around 10% of household contacts become infected when someone catches SARS-CoV-2. Papers that claim higher attack rates often have fallen into one of two traps. The first is to rely on a small sample size. Basing policy on small samples that are clearly outliers in terms of the core data is a bad idea. The second trap is to fail to exclude situations where two people infected in a household were infected together from the same index case but, perhaps, with differing incubation periods.
Between variant waves the virus wanes. This has occurred in every country after every wave. Nowhere has seen a resurgence in cases after restrictions were lifted. Texas and Mississippi lifted their restrictions in early March 2021 when hospitalisations were still occurring at more than half their recent peak. These declined to low levels until the arrival of the delta variant. The December surge in the UK in 2020 was due to a new alpha (or Kent) variant, not the release of restrictions. The periods of virus waning, between waves, indicate that the susceptible population has been found and only with a new variant, and a new susceptible population, does a new wave begin. The exceptions included places where the natural curves have had their trajectories disturbed through rises and falls in vaccinations which have led to unnatural increases in the susceptible population.
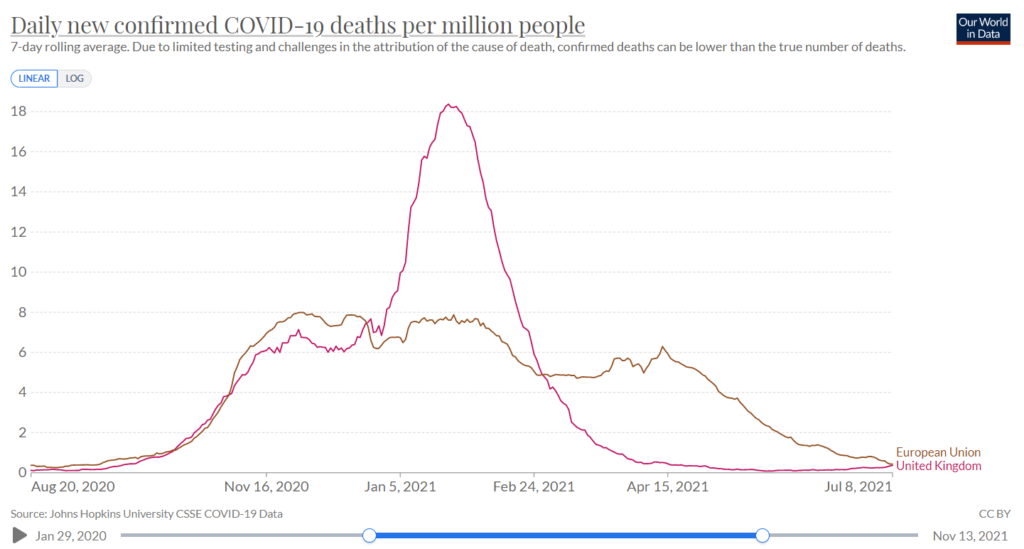
The marked difference in the covid death curve in the UK compared with the European Union shows a much earlier trajectory here which may well be attributable to the more rapid vaccine rollout. However, the number of people who died per million (represented by the area under the curve) was similar for both. The implication of this is that each variant will find the susceptible population and once those people have been found that variant will disappear, which is borne out by recent analysis that shows — at a population level — that Covid does not materially affect the mortality of cohorts of people who are 65 or younger.
The most interventions can achieve is to slow the spread and potentially ‘flatten the curve’, though even this can cause difficulties if such an intervention interferes unfavourably with other effects, such as seasonality. Where countries (or regions) have apparently avoided viral waves, neighbouring countries usually avoided the same wave making clear that these outliers are geographical phenomena and ‘success’ should not be credited to changes in human behaviour. The total number of people who will be infected and die from each variant will likely be the same regardless of human behaviour.
