

The long awaited data is riddled with issues
After a seven month hiatus the ONS have finally released data on deaths by vaccination status but it is all very odd. Numerous analyses have been written on the findings as well as critiques of the quality of the data; this article will be an attempt to summarise them. Needless to say the mainstream media have pronounced that it shows the vaccine is a miracle cure-all, reducing all-cause as well as covid-related mortality. Sarah Caul MBE, Head of Mortality Analysis at the ONS, has responded to some of the concerns raised regarding the data and this has resulted in some corrections but not, as yet, for all of the issues.
Failure to comply with UK Statistics Regulator’s requirements
The UK Statistics Regulator had required the ONS “to address some of the sampling issues present in the first six iterations of the publication” and noted that “when the analysis is updated it will include more breakdowns by smaller age bands. It is important that this is done promptly.” These requirements have not been met, as the ONS used a very wide age band for young people (18-39 year olds were put into a single group) and seven months surely cannot be regarded as ‘prompt.’
Data errors
Since the initial release the ONS have had to release three revised versions to correct mistakes.
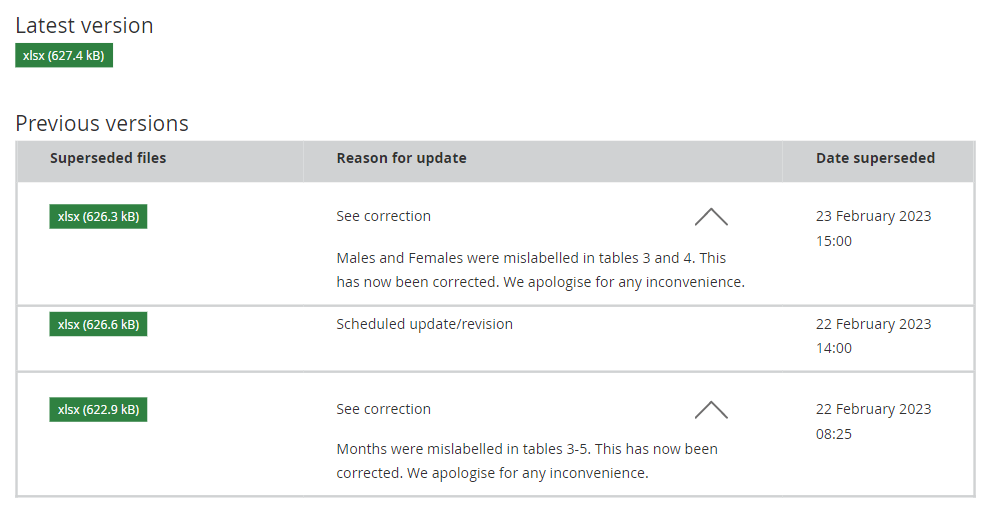
These included both missing and mislabelled data. Hours of work carried out by numerous people had to be discarded with each new release. For example, the ONS transposed the labels for males and females meaning this analysis had to be discarded.
Missing data
The release excluded data on:
- Children — no explanation for this omission has been provided
- January-March 2021 (this was because their new analysis was based on people alive from April 2021)
- No deaths were included in table 5 (all deaths for whole population) after September 2022
- There was no entry for covid deaths in 18-39 yr olds in Aug 2022.
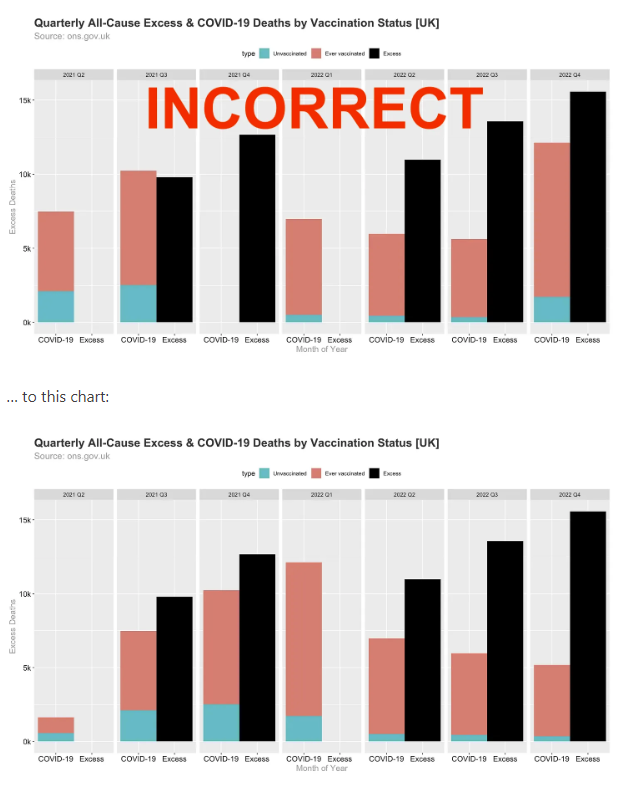
Correcting the labels of the months resulted in this change of analysis which compares excess deaths by age with covid deaths.
Another major problem with all the analyses of the ONS data in its current form is that they have used data of deaths by date of occurrence, and there is a significant undercount for recent deaths not yet registered. As deaths are registered, the numbers by date of occurrence for the most recent months will increase. For example, for all of 2022, the ONS have included a total of 504,251 deaths in England. In contrast, the UKHSA report on daily deaths by date of occurrence already includes 545,234 deaths for 2022. This suggests the ONS have been working with data that is several months out of date. If they had included more recent data then the deaths included would be higher — but we don’t know how high.
Ultimately, the issues around excess deaths in late 2022 cannot be studied based on this data because there are too many deaths in late 2022 missing from the data.
Below is an example of a chart based on the initial ONS release on 21st February and then recalculated using the latest 23rd February version.
Data Discrepancies
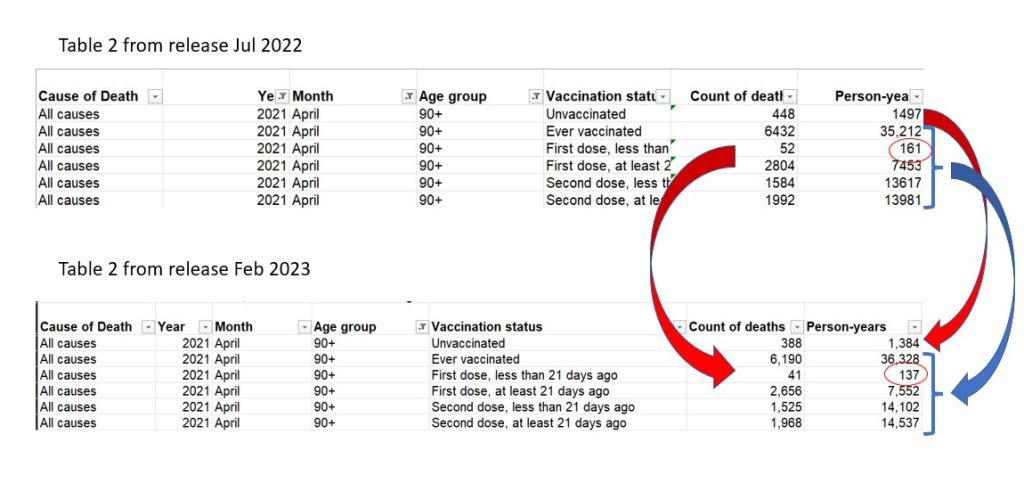
There are remaining anomalies, including the fact that the deaths in the over 90s population has increased since the July 2022 release, while there are apparently fewer deaths in the 80-89 year old population than in that release. This suggests the ONS might be using a hypothetical current age for categorising by age rather than the actual age at death of each person.
An example of discrepancies between the previous release in July 2022 and the February 2023 release can be seen in figure 3. The people included in the later release were people who completed census forms on 21st March 2021. Perhaps a decrease in deaths might be expected if frail people, a month or less from death, were asked to complete a form. Carers may also feel that time is better spent at the bedside in the precious last days rather than filling out a form. However, in the meantime the number of over 90 year olds who were vaccinated increased while the number who were unvaccinated fell.
Conclusion
Although the seven month wait for more data from the ONS has finally ended there continue to be serious issues with the data that they are producing. The issues raised by the UK Statistics Regulator have not been addressed and the bias that leads to huge discrepancies in non-covid mortality remains.
