

How much was virus versus response?
Although covid undoubtedly killed people, looking at its fatality in retrospect, the claimed lethality does not always match what we now know about the virus. There are particular examples such as New York City and Lombardy where the alleged covid mortality figures are well in excess of what was seen elsewhere, and suggest other factors must have been at play. With that in mind it is worth re-examining the excess death waves to understand better what proportion was caused directly by covid and what could have been caused by the response to covid. Deaths that were caused by the propaganda and panic along with policy will be referred to as Response Deaths. Deaths due to policy could also rise and fall in a wave, particularly if the policy issues are related to fear and panic, these will rise and fall with the numbers of cases reported. Indeed, as well as covid deaths, deaths in spring 2020 that were explicitly certified as not due to covid rose into an excess and then fell away during the covid wave.
It is useful to divide these types of deaths during each excess mortality wave into four categories:
- Inevitable deaths from covid
- Response related deaths from covid
- Misattributed deaths labelled as covid
- Response related deaths from non-covid causes
The proportion of deaths in each of these categories is difficult to ascertain with current information, but it is important to try to provide some estimates.
A. Inevitable deaths from covid
With each covid wave there was a wave of other indicators that people were becoming ill with a virus and a proportion were dying of it.
There was a tight correlation between the following which came and fell in waves:
- Diagnostic testing
- People with symptoms of respiratory disease
- Hospital admissions for the respiratory disease
- Intensive care admissions for the respiratory disease
- People died having had a respiratory disease
Measures of disease using antigen testing and antibody testing produces a very different trajectory to that measured using PCR testing. However, the former still indicate waves of viral infection.
Even in the absence of any diagnostic testing, there was a clear rise and fall in excess deaths attributed to an acute respiratory infection.
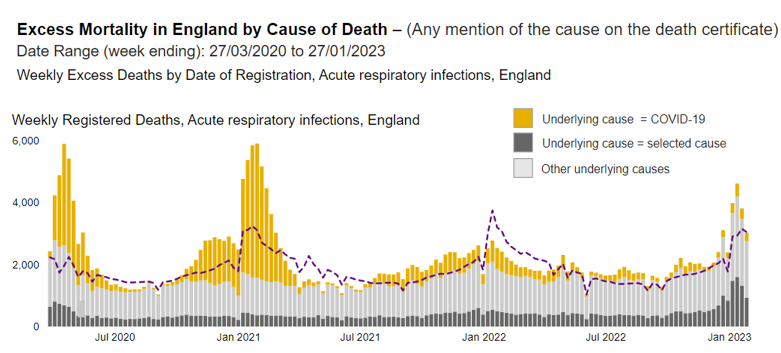
Figure 1: Excess deaths with a mention of acute respiratory infection on death certificate
These waves occurred at different times in different regions.
There has never been a significant wave of covid attributed deaths without an associated wave of excess deaths. Conversely, there has never been a wave of excess deaths without associated covid deaths. Covid deaths therefore occurred during these excess death waves.
It must be stressed that just because a death was correctly classified as covid, including those with respiratory symptoms, does not necessarily mean that the same person would not have been killed by a different respiratory virus had it been the dominant virus circulating at the time.
B. Response related deaths from covid
The proportion of patients hospitalised for covid who went on to die rose and fell with each wave has not been constant. The very high early figures were likely due to underdiagnosis of hospital admissions. However, thereafter it is clear that the Wuhan and Alpha hospital fatality rates were both over 30% whereas for Delta it was under 20%. When using the same measure of deaths (within 28 days of a positive test) the Omicron hospital fatality rate is similar to Delta. This is highly suggestive of other factors changing the chances of survival during a wave.
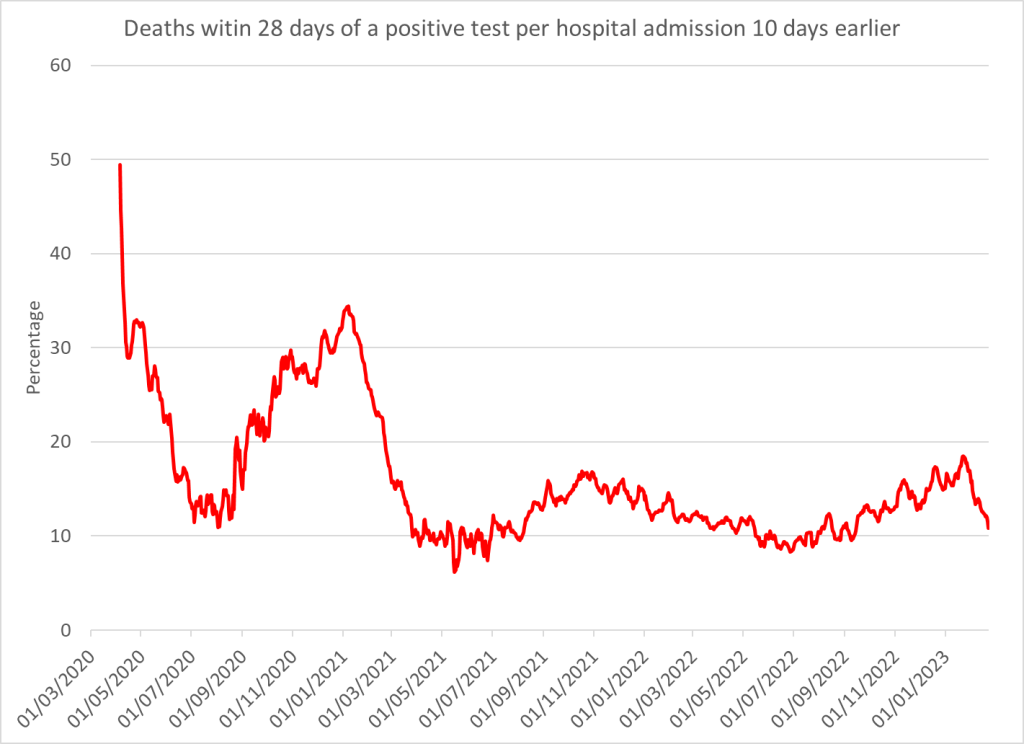
Figure 2: Hospital fatality rate with 10 day lag – data from government dashboard
Response related deaths from covid in Wuhan wave
- Over ventilation Recommendations for early ventilation and reports that alternatives will lead to higher risk of infection in healthcare staff meant that decisions to ventilate were not always taken in patients’ best interests. When policies changed to minimise ventilation, the covid mortality rate reduced, indicating that lives had been lost due to over-ventilation in the first wave. New York City seemed to have a particular problem with over ventilation with huge variation in mortality between hospitals within the city. Terrible mistakes were made closer to home — the statistics will say that 13-year old Ismail Mohamed Abdulwahab died on 30 March 2020 ‘of’ covid, but almost three years later a coroner has ruled that, tragically, the cause of death was an entirely avoidable misplaced endotracheal tube.
- 90% of covid deaths in spring 2020 did not receive intensive care before death. Intensive care consultants wrote about how these were the people who most needed their care and yet people had been following guidance documents that disqualified those who were old or had comorbidities from treatment.
- Blanket ‘do not resuscitate’ (DNR) orders were issued, e.g. to entire care homes or all patients on a GP list with a learning disability. This occurred at the same time as hospitals introduced policies not to admit anyone with a DNR. These policies were reversed from April/May 2020 but this would have impacted on spring 2020 deaths.
- Using the entire machinery of state plus all social media and legacy mainstream media channels to promote an exaggerated narrative of fear aimed at the public and spilling over into healthcare workers, when it is well established that stress has a number of adverse health effects, including immuno-suppression.
- Did people with covid fail to ask for help early enough? There is sound evidence that people did not access healthcare services as before, with emergency department attendances halving, including for serious conditions. There was confusing messaging where people were told not to attend hospital if they had a cough or fever. Perhaps those with covid feared they might contribute to overwhelming the NHS and so had a higher threshold than they would have normally had for seeking help. How many died as a result of this?
- No early treatment was offered. Patients were told to wait until they were sick enough to need admission before they would receive any medical care. They were therefore denied the psychological benefit of feeling cared as well as any physical benefit that may have come from simple interventions such as Vitamin D supplementation. Community acquired pneumonia was no longer treated with antibiotics, even though they were used in original SARS. These have a direct antiviral impact as well as reducing the risk of secondary bacterial infection. From May 2020, Remdesivir became the standard of care despite showing no reduction in hospitalisations and deaths and evidence of injury to every fourteenth person treated. Protocols meant that end of life drugs may have been overused causing harm.
- Health and care staff were told to isolate for 14 days if they had a cough or fever. Over time this policy switched to testing. Even with accurate test results a large proportion of staff could be expected to test positive during a wave particularly as many were exposed to virus at work and the testing was so sensitive.
- Fear and understaffing in care homes as well as banning visitors led to the demise of some care home residents with covid because they didn’t get the hydration they needed. In the UK alone, it is known that 345 tragically expired in this manner in hospitals and care homes during the first lockdown, an increase of just under 50% from the previous five year average for the same timescale. For how many more was this a factor?
Response related covid deaths in autumn and Alpha wave
- Over ventilation was a well understood issue later in 2020 and policies had changed such that mortality from should have reduced.
- It is not clear what policies were in place for intensive care for this period especially as we neared the peak in intensive care admissions.
- Blanket do not resuscitate orders were reversed in May 2020. There was a second, smaller peak in prescriptions for Midazolam in January 2021 but not, oddly, in London. London bore the brunt of covid deaths in January 2021 so why were other places prescribing considerably more Midazolam than London?
- The fear campaign was in full swing which could again have contributed to immune suppression through stress.
- The reduction in attendances at the emergency department was repeated. Attendances for respiratory disorders including acute respiratory infections were both well below normal levels.
- By December 2020, Pierre Kory was presenting the compelling evidence for Ivermectin in the Senate. Despite it being a well established safe intervention, no attempt was made to ensure patients could benefit from it. Remdesivir treatment continued.
- Again, staff absences would have peaked around the time of peak deaths.
- Issues around staffing and visitors in care homes were repeated with an increased risk of dying of dehydration. However, excess deaths in care homes were at a much lower rate. It is difficult to know how many deaths should have been expected — were care homes as full as they would have been normally?
- The first two weeks after covid vaccination results in a period of immune suppression. Covid rates were higher in this period than in the unvaccinated. An infection while immunosuppressed could be expected to lead to a higher death toll.
Response related deaths in subsequent waves
- Over ventilation was unlikely to have contributed.
- Pressures on intensive care were not as severe.
- Blanket do not resuscitate orders were reversed in May 2020.
- The fear campaign was reduced.
- The reduction in attendances at the emergency department was repeated but the fall in overall attendances was much less and the number attending for an acute respiratory infection was higher than baseline levels.
- Evidence on the use of early intervention with Budesonide inhalers was available from April 2021 and showed a 91% reduction in hospital admissions but its use was only briefly recommended by the NHS. Remdesivir treatment continued.
- Again, staff absences would have peaked around the time of peak deaths.
- During covid outbreaks care home rules were still incredibly strict such that the available staff and visitors were reduced for covid patients and there would still have been an increased risk of dying of dehydration.
- The issue of immuno-suppression immediately after vaccination would still apply with subsequent doses. Furthermore, the evidence of booster failure and changes to the immune response to the virus on repeated dosing may also have contributed to additional covid deaths.
The evidence to put a number on each of the above is not available but it is fair to say that the number will be above zero.
C. Misattributed deaths labelled as covid
What proportion of covid deaths were deaths that were genuinely because of covid rather than with covid? There is a great deal of subjectivity around answering this question on an individual level. If someone died of cancer but with a positive covid test can it really be classed as a covid death if they were going to die that day anyway? What about if they would have lived an extra week? A month? 6 months? Who can guess how long they would have lived? Certainly in the past we have not obsessively tested dying people trying to find a virus that could then be recorded as a culprit for that person’s death. Indeed, the dying usually have diminished capability at keeping infection at bay with at least 47% of people who had died of all causes testing positive for a respiratory virus.
At a population level we can see that there were periods of overdiagnosis. That makes assessing what happened with regard to non-covid excess deaths much harder.
Misattributed deaths in Winter 2020/2021
- Case Fatality Rate differences show different death attribution
If all excess deaths were viral deaths then we should see a similar case fatality rate for countries with similar demographics, morbidities and testing strategies. There are several examples of similar neighbouring countries where one had twice the CFR of the other in 2020 or 2021 despite similar hospitalisations e.g. UK vs Ireland (despite converting from Feb 2021); Germany vs Denmark and Greece vs Cyprus.
- Underdiagnosed deaths from other causes
Non-covid causes of death disappeared in direct proportion to the number of deaths labelled as caused by covid. This happened at the end of the spring 2020 wave, through autumn and winter 2020/2021 and again when covid deaths replaced what would have been influenza deaths in the winter of 2021/2022.
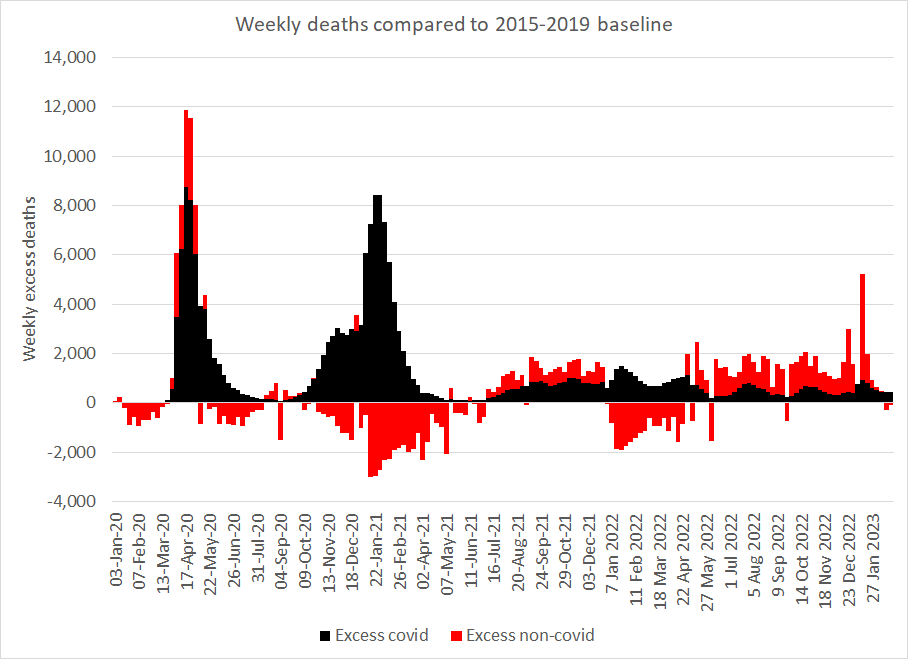
Figure 3: Missing deaths from non-covid causes in certain periods — negative bars (red) show periods of lower mortality compared to the 2015-2019 baseline
- The proportion of covid deaths where there was a mention of acute respiratory infection. Only around 55% of covid deaths had a mention of acute respiratory infection on the death certificate in spring 2020 and summer and autumn 2021 and that proportion fell with overdiagnosis of covid deaths to only 31% in autumn 2020 and 38% in winter 2020/21.
Misattributed deaths in Spring 2020
- Underdiagnosed covid
In April 2020 there were 2,246 excess deaths with a mention of acute respiratory infection that were not labelled as covid deaths. These were either underdiagnosed covid deaths or else were deaths from other respiratory infections in excess of what would have happened without the response. Doctors were free to diagnose covid in the absence of a positive test result and there were 13,000 more death certificates that mentioned covid than people who had died within 28 days of a positive test result (26% of covid death certificates were not in people with a positive test result). This suggests that the latter is a more likely interpretation but there is no certainty in this.
- Incidental covid diagnosis
It is widely accepted that because many cases of Omicron are mild there will be people, even in hospital, who test positive when the real reason for their admission was not covid. The majority of cases of pre-Omicron variants were also mild and this will be true for those too. However, the number of deaths attributed to the earlier covid variants matches the number who died within 28 days of a positive PCR test. There must have been overdiagnosis for this to have occurred.
- Symptomatic covid trajectory
When more than 10,000 people who developed antibodies were asked when they had their symptoms the trajectory in spring 2020 was quite different to the trajectory shown for PCR positive ‘cases’. Critically, symptomatic disease had reduced to near zero by mid April while PCR positive cases did not return to zero and did not reach a minimum until July 2020. Because early testing had a bias towards hospitalised patients one might expect a later peak than the peak of when symptoms began. It might also be expected that the curve would be wider as people present at different times after symptom onset. However, it is impossible to explain the huge number of positive test results in May and June 2020 without overdiagnosis.
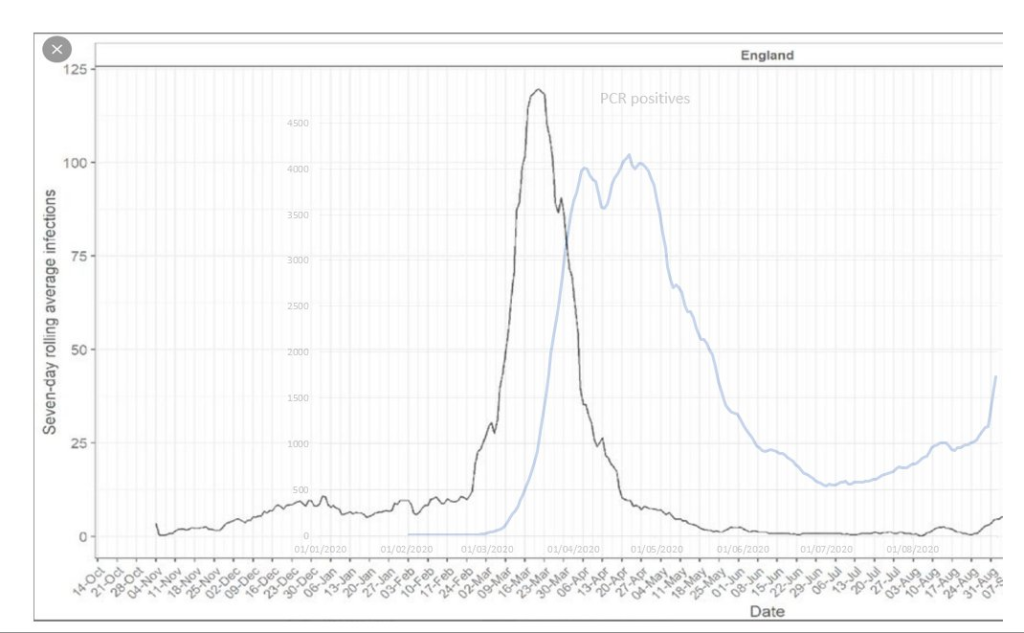
Figure 4: Black line shows trajectory of symptomatic disease in those who developed antibodies and blue line shows PCR positive ‘cases’
- A team at Imperial published an audit showing that the majority of their “covid patients” did not have acute covid after 21st April. Despite this almost all deaths within 28 days of a positive test result was still being certified as a covid death.
- It is now well established that viral RNA can end up in a cell’s DNA and cause positive test results for up to three months after infection.
Estimating the extent of overdiagnosis
An extreme assumption could be hypothetically made that genuine covid deaths would all appear as excess acute respiratory infection deaths. If so, for every excess acute respiratory infection death there is roughly one other death that matches the timing of the wave. It seems highly unlikely that deaths from other causes would correlate perfectly with covid deaths. Furthermore, covid pathology extends beyond acute respiratory infection and even patients that did die with an acute respiratory infection may have had another more pertinent cause on their death certificate.
If, however, we assume that only 55% of covid deaths include a mention of an acute respiratory infection then we get a trajectory of covid deaths as shown in black below. Any lower than 55% would give more covid deaths for the Delta wave than were certified as covid deaths. Therefore 55% seems like a reasonable lower limit.
Modelling covid deaths based on those certified as mentioning an acute respiratory infection shows overdiagnosis in spring 2020, especially after peak deaths and significant overdiagnosis in winter 2020/2021, but not subsequently. With this assumption a clear wave of excess non-covid deaths was present in spring 2020 but a similar excess was not seen in winter 2020/2021.
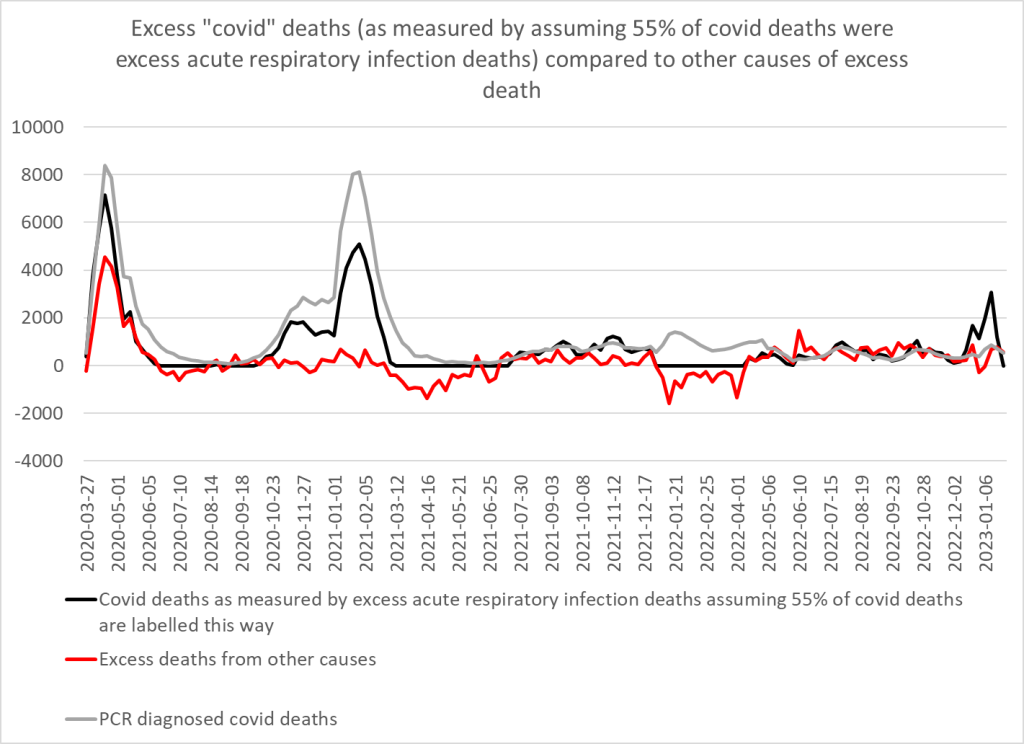
Figure 5: Modelled covid deaths based on 55% of covid deaths having a mention of an acute respiratory infection on the death certificate compared to residual excess deaths from other causes
Using this model 96% of Delta wave covid certified deaths are accounted for compared to 90% of Omicron deaths (up to end November 2022), 66% of Wuhan deaths, 58% of autumn 2020 deaths and only 50% of Alpha wave deaths.
Although the total excess (over 2015-2019 average) in winter 2020/2021 can be explained by covid there remains a question of how many deaths should have been expected that winter. The fact influenza disappeared introduces another variable. A proportion of the covid deaths above the line would actually have substituted for expected influenza deaths below the baseline of expected deaths. The fact that there were still non-covid deaths that reached the baseline in the absence of influenza suggests that more deaths occurred than normal which were not due to either covid or influenza. Furthermore, after a period of high levels of respiratory and other deaths, it is reasonable to expect the following winter to have fewer deaths than expected on average. The fact non-covid deaths still reached expected levels suggests some of those deaths may have been response related.
D. Response related deaths from non-covid causes
The presence or absence of “lockdown” is not relevant to the impact on deaths. Lockdown may have correlated with other policies but it was the policies that affected the old and sick that were the ones that could have led to excess deaths and these must be examined independently of policies that affected the young and healthy. There were many excess deaths in spring 2020 certified as due to non-covid causes that rose and fell in a wave with a peak (week ending 24th April) the week after peak covid deaths.
All these policies would lead to a wave of excess death that would be expected to coincide with the timing of the covid wave itself.
- Patients were told to stay home if they had a fever or a cough. Pathologists in Oxford called out such deaths in 2020 in the Lancet. People were denied life saving care because they’d had a fever or a cough and were told to isolate rather than attend hospital. This issue would have also applied in Winter 2020/21 but not for subsequent waves.
- Isolation of health and care staff if they had a cough or fever would have reduced available care including for life threatening situations.
- Blanket do not resuscitate orders at the same time as hospitals introduced policies not to admit anyone with a do not resuscitate order. These policies were reversed from April/May 2020 but this would have impacted on spring 2020 deaths.
- Hospitals were cleared in preparation for a surge in spring 2020.
- Ambulance calls for chest pain rose and peaked around 22nd March 2020 shortly before the peak in calls for breathing difficulties on ~25th March 2020. This rise was likely related to the virus. However, the calls for cardiac and respiratory arrests continued to rise beyond 25th March peaking around 5th April 2020 and remaining above normal levels there after. Although the earlier rise may also have been related to the virus the later peak and continued high levels, at a time when chest pain calls were well below normal levels suggests people were not calling for an ambulance when they developed chest pain and instead others were calling on their behalf after they had an arrest.
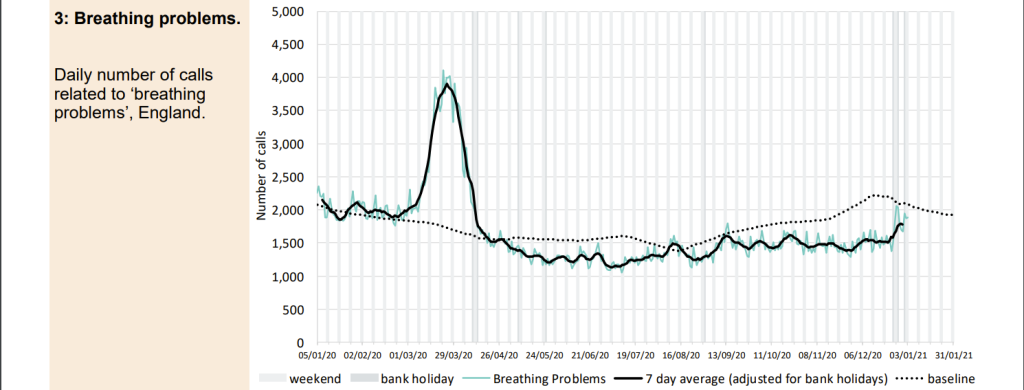
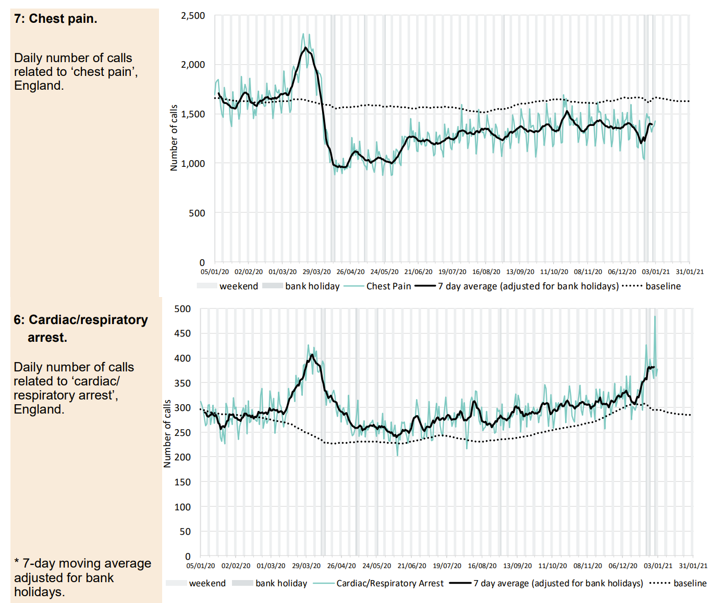
Figure 6: Data on ambulance calls for all England Ambulance trusts classified as breathing problems, chest pain or arrest calls
- Emergency department attendances halved, with those having heart attacks and strokes not attending when they had a life threatening emergency. The fall recurred with the winter 2020/21 wave but less so with subsequent waves.
- Operations carried out at less than half of normal levels in spring 2020, even for conditions that are life threatening in a Milan hospital. If that was repeated elsewhere it is bound to have contributed to deaths.
- Decisions about who would receive intensive care changed such that those with a lower chance of survival who in the past would have been given that chance, were no longer treated. It is not clear if similar policies were enacted in winter 2020/21 but such decisions were unlikely subsequently.
- Fear and understaffing in care homes and banning visitors would have reduced the level of care available to care home residents and particularly their chances of remaining hydrated which could have impacted on mortality. The caveat must again be added that there were far fewer excess deaths in care homes after the first wave but it is difficult to know if care homes were as full as they would have been normally?
What is an excess death?
It matters a great deal what the levels of death are being compared to. The choices are:
- The five year average mortality for that time of year — half the time we would expect deaths to be higher than this value but we can estimate what a reasonable expectation would be
- A comparison to earlier years when we had bad flu seasons. The number of deaths (covid and non-covid) per 100,000 people was similar to previous bad winter waves of death e.g. 1989, 1990, 1997, 1999, 2000. The unusual feature was the timing of that wave in spring 2020. With this comparison, even including non-covid deaths, there was no excess in England above bad years from previous decades.
Plotting weekly deaths since 1993 shows that the spring 2020 wave of excess deaths was unusual in its timing but not its magnitude. Removing the excess of non-covid deaths in that period makes it even less remarkable. Adjusting for population size and age would bring the peak down further still. Removing those covid deaths that were contributed to by the response would also bring the peak down further.
Similarly the winter 2020/2021 peak, while higher than the 5 year average is comparable to earlier peaks. The winter 2022/2023 peak is also of a similar order.
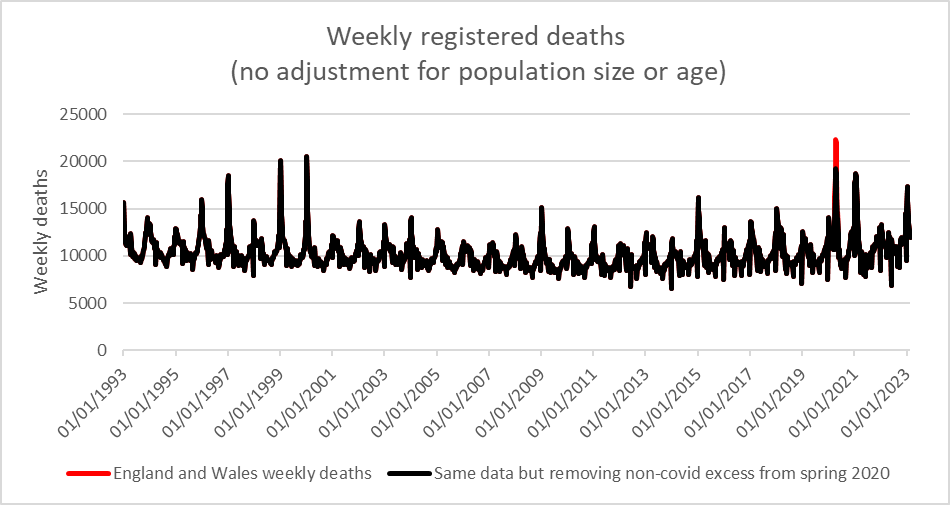
Figure 7: Weekly deaths since 1993 with same data after deaths described as due to non-covid in first lockdown were removed (black)
The overall mortality rate (deaths per 100,000 people) from June to May for 1998-2021 is compared to that for 2019-2021 in the table and figure below.
| Mortality rate per 100,000 people | |
| June 1998 – May 1999 | 1081 |
| June 1999 – May 2000 | 1056 |
| June 2019 – May 2020 | 991 |
| June 2020 – May 2021 | 968 |
Table 1: Mortality rate for each year June-May comparing 1998-2000 to 2019-2021 using ONS population estimates
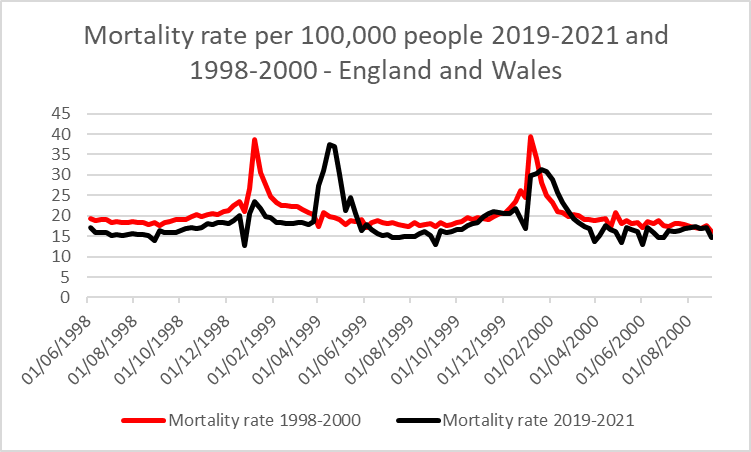
Figure 8: Mortality rate per 100,000 each week comparing 1998-2000 to 2019-2021
Conclusion
There remains uncertainty about how many excess deaths during covid waves were due to covid rather than the response to covid. When considering that not all covid deaths were inevitable covid deaths the picture becomes even harder to untangle. Using acute respiratory infection deaths as an alternative measure shows that the majority of deaths above 2015-2019 levels were covid deaths but there was a significant wave of non-covid response related deaths in spring 2020. Removing these response related deaths from the equation shows that the covid trajectory alone was within the range seen in previous winters for influenza deaths but was at an unusual time of year. Subsequent peaks in death have been of a similar order and have occurred at the expected time of year, with or without a significant contribution from covid deaths.
Some have focussed on the question as to whether SARS-CoV-2 on its own caused some excess deaths. Whether it did or didn’t isn’t really the right question.
It is more instructive to ask:
Had the same biological set of circumstances arisen in 1975 before PCR had been invented and before the internet was able to spread panic and fear, and had the response therefore not been any different to any previous respiratory viral infection, what would the history books be saying about 1975?
The key question in relation to this is:
Did we have an unprecedented deadly pandemic which justified what happened and justifies future “surveillance” and vaccines at the ready, WHO treaties and new IHRs to stop it being so bad next time?
OR
Were we (for whatever reasons) actually played, in that there would have been nothing unprecedented about the deaths if we had behaved normally?
While there are plenty of people who agree that the various misadventures of the last three years should never be repeated, the latter question is very pertinent, as it highlights the need to ensure we do not double down on these mistakes by making false assumptions about this sorry episode. If the answer to that last question is ‘yes’, the whole concept of ‘pandemic preparedness’ is decidedly suspect, and the very fact that it is enthusiastically supported by the industrial-military-medical complex might well be an indication that citizens’ health (and wealth) might well be quite low on the agenda of those ‘pandemic preparedness’ evangelists.
