

What can we learn from them about excess deaths?
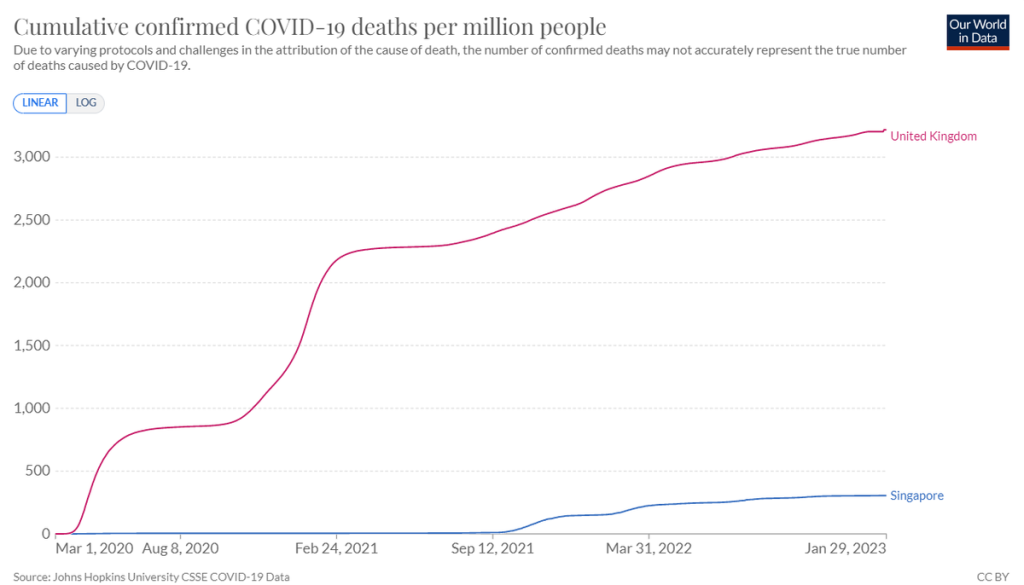
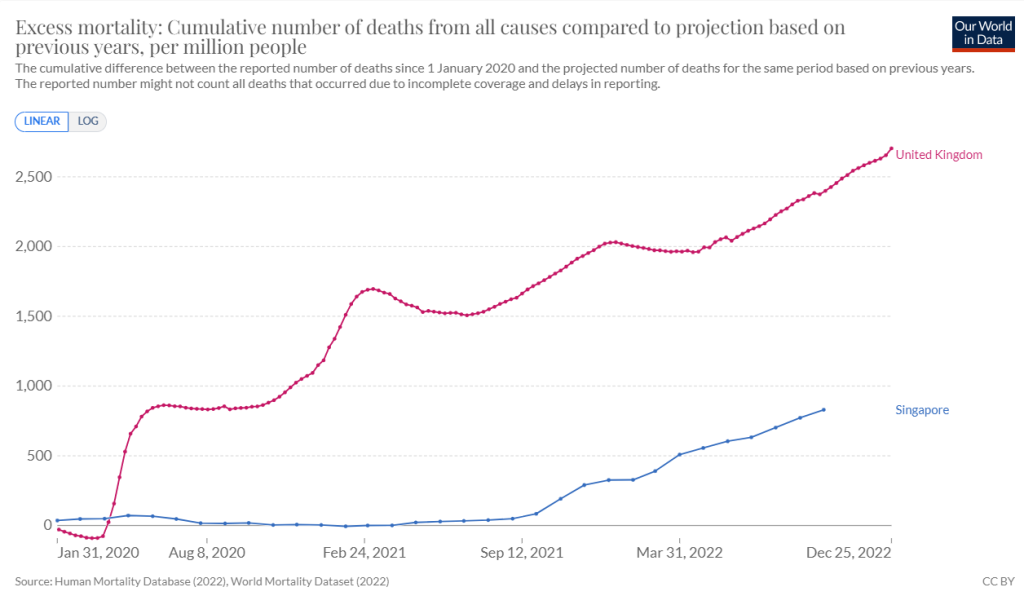
The Singapore government released data on their excess deaths in 2021 which is a window into what has caused excess cardiovascular deaths. Singapore is interesting because covid deaths did not feature until September 2021. Prior to that date only 29 deaths had been attributed to covid.
It is worth noting that cardiovascular disease is not a prominent cause of death in Singapore. In 2021, 28% of deaths were from cardiovascular disease compared to 48% in England. Given those pieces of information we can predict what would happen under different hypotheses.
Hypothesis 1: Covid caused excess cardiovascular deaths
Hypothesis 2: Long covid caused excess cardiovascular deaths
Hypothesis 3: Lack of access to healthcare from fear and lockdown
Hypothesis 4: Vaccine related increase in cardiovascular disease
Hypothesis 1: Covid caused excess cardiovascular deaths
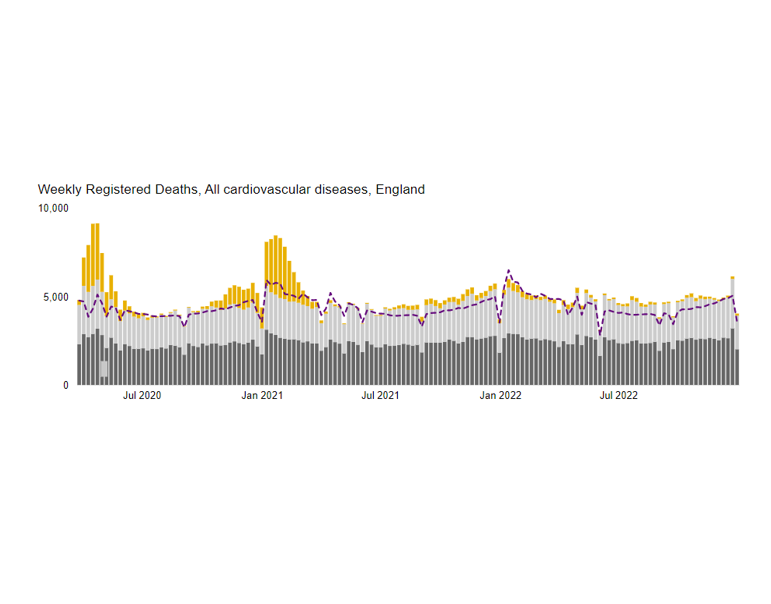
This is an odd hypothesis because there were no non-covid excess cardiovascular deaths following covid in England in 2020 (grey bars above purple line). But it’s a popular hypothesis so let’s go along with it.
Covid accounted for 3% of deaths in Singapore in 2021 but 14% in England. The lower proportion of deaths and the fact covid did not really take off until Sept 2021 in Singapore, means that if this is the cause we would expect fewer excess cardiovascular deaths in Singapore.
Hypothesis 2: Long covid caused excess cardiovascular deaths
If they were long covid related then we would expect an effect in England but not Singapore where only a tiny fraction had been infected by end of 2021 and only for a short time.
Hypothesis 3: lack of access to healthcare from fear and lockdown caused later excess cardiovascular deaths
Singapore did have a spring 2020 lockdown and some people stopped accessing healthcare. Emergency department visits reached a nadir of 75% of normal.
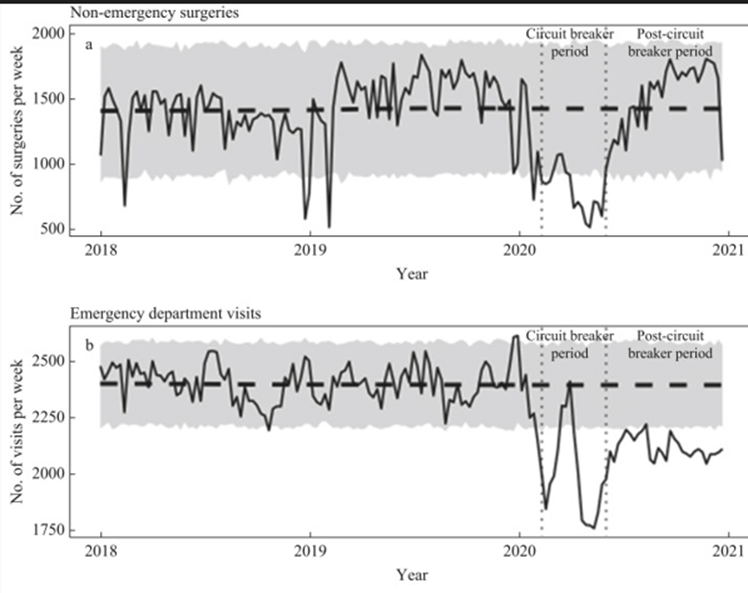
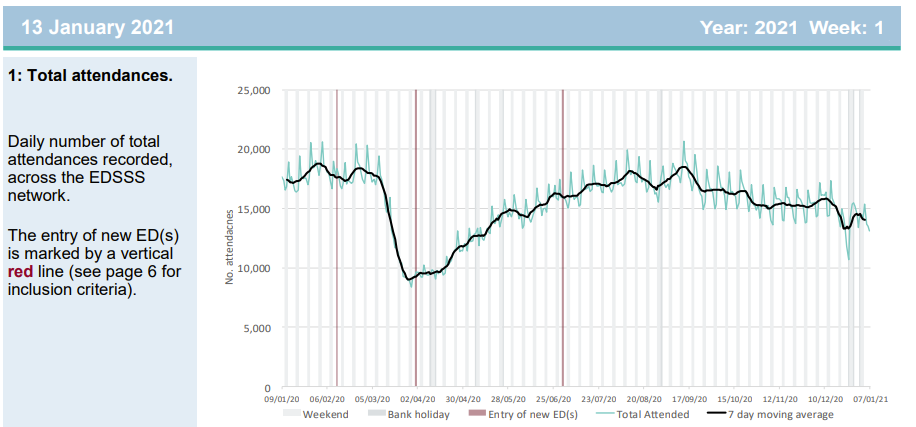
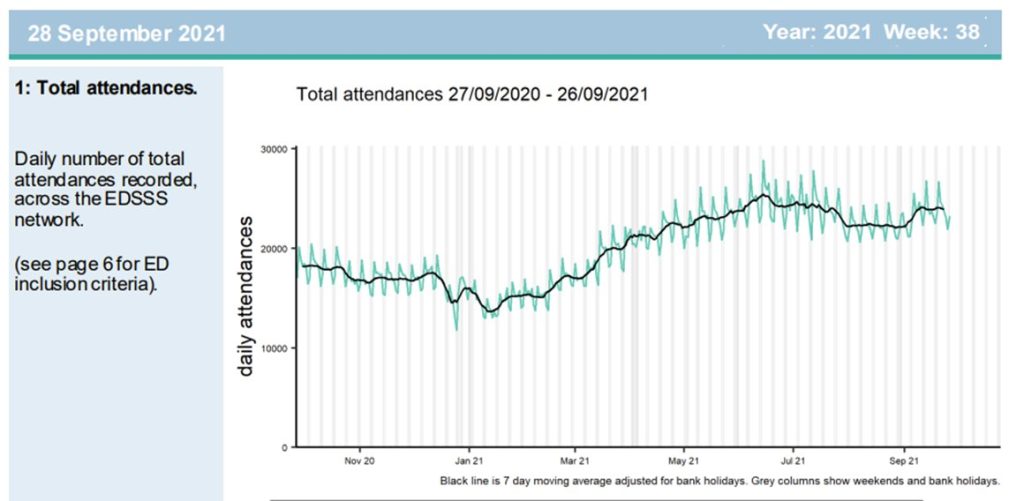
By contrast in England the fall in emergency attendances reached as low as half of normal levels. Unlike in Singapore, in England a second period of lack of access in the second lockdown will also have had an impact. From early 2021 demand increased to above previous levels. This can not be attributed to ambulance delays as this was the total number of people sick enough to need to attend the emergency department.
Although Christ Whitty claimed that a reduction in statin prescriptions could have led to recent cardiac excess deaths, the levels of prescriptions were in fact maintained. Moreover the British Heart Foundation estimated that a lack of preventative care would lead to an extra 12,000 heart attacks or strokes over a five year period, the vast majority of whom would not die, which is far too few to account for the increase.
The psychological impact of lockdowns including lack of access to healthcare, could, however, have acted directly as a risk factor for cardiovascular disease that then led to a longer term impact on cardiovascular events.
The UK government estimated a significant increase in excess death from cancelled elective procedures with some uncertainty depending on how well the backlog was cleared subsequently. It is unclear how much impact such delays would have had on cardiovascular deaths.
Hypothesis 4: Vaccine related increase in cardiovascular disease
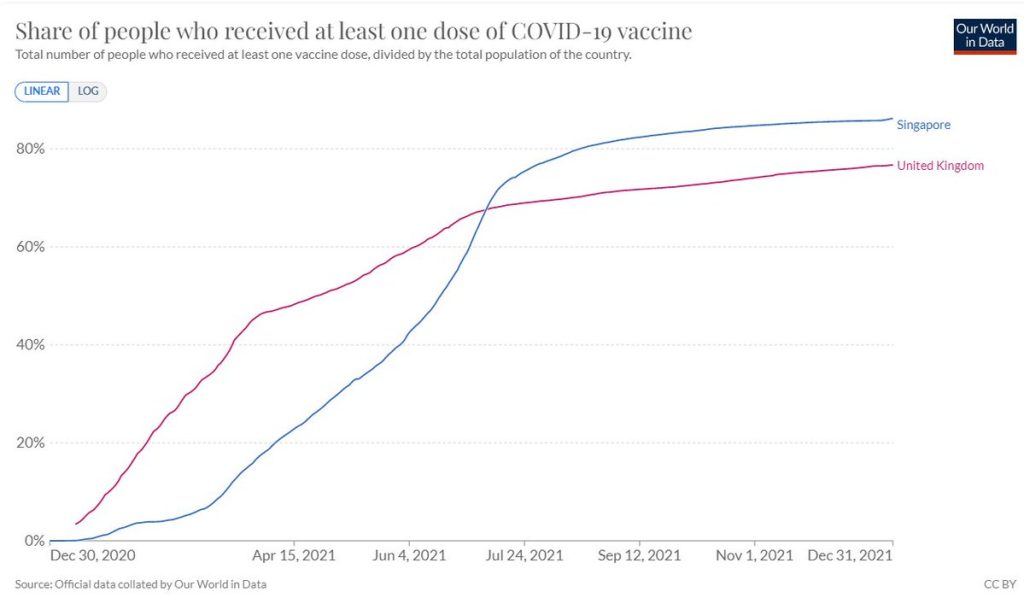
Singapore vaccinated one to two months later but ended up giving marginally more doses by end of 2021. If it were vaccine related, then we would expect a similar rise in both countries.
Which hypothesis is supported by the evidence?
What would we expect excess cardiovascular deaths (CVD) to look like in 2021 in Singapore compared to England under each hypothesis?
| Covid | Long Covid | Lockdown | Vaccines | |
| Singapore | Minor compared to England | Minimal compared to England | Some but less than England | Similar to England |
N.B. It might be that more CVDs would be expected in England from any of these causes because of there being a higher susceptibility to CVD.
Having established what we would expect, let’s look at what happened. I have compared 2021 deaths by cause in Singapore with 2020 levels to give a percentage excess. For England I have used the UKHSA expected deaths data from here.
First, there has been a similar minimal rise in cancer deaths in both countries. By contrast, the rise in cerebrovascular disease (strokes) and ischaemic heart disease (heart attacks) is substantial in both countries.
| Singapore % increase in 2021 | England % increase in 2021 | |
| Cancer deaths | 1% | 1% |
| Ischaemic Heart Disease Deaths(heart attacks) | 8% | 14% |
| Cerebrovascular Disease Deaths (strokes) | 12% | 9% |
The overall increase in cardiovascular deaths was 9% in Singapore and 14% in England.
| Singapore Number of excess deaths in 2021 | Singapore % increase in 2021 | EnglandNumber of excess deaths in 2021 | England % increase in 2021 | |
| Cancer deaths | 88 | 1% | 1723 | 1% |
| Ischaemic Heart Disease Deaths(heart attacks) | 357 | 8% | 12589 | 14% |
| Cerebrovascular Disease Deaths (strokes) | 159 | 12% | 4458 | 9% |
| All cardiovascular deaths | 587 | 9% | 32751 | 14% |
| Total covid deaths in 2021 | 800 | 76138 |
Remember the first 9 months of 2021 saw no covid deaths in Singapore at all, leaving little time for the rise in cardiovascular deaths to have been caused by covid.
There is a clear signal of increased cardiovascular disease in 2021 in Singapore which has very low rates of cardiovascular disease normally. The total number of excess cardiovascular deaths in 2021 would represent three excess cardiovascular deaths for every four covid deaths. In contrast, there was one excess cardiovascular death for every two covid deaths in England. Why would Singapore have more cardiovascular deaths caused by covid than England? Did covid lead to proportionately more cardiovascular disease in Singapore than in England? That would be rather odd given the higher propensity for cardiovascular disease in the English population.
Long covid can’t explain the large increase in cardiovascular deaths in Singapore when they had had so little covid prior.
A lack of access to healthcare because of lockdown and fear cannot be ruled out as a cause.
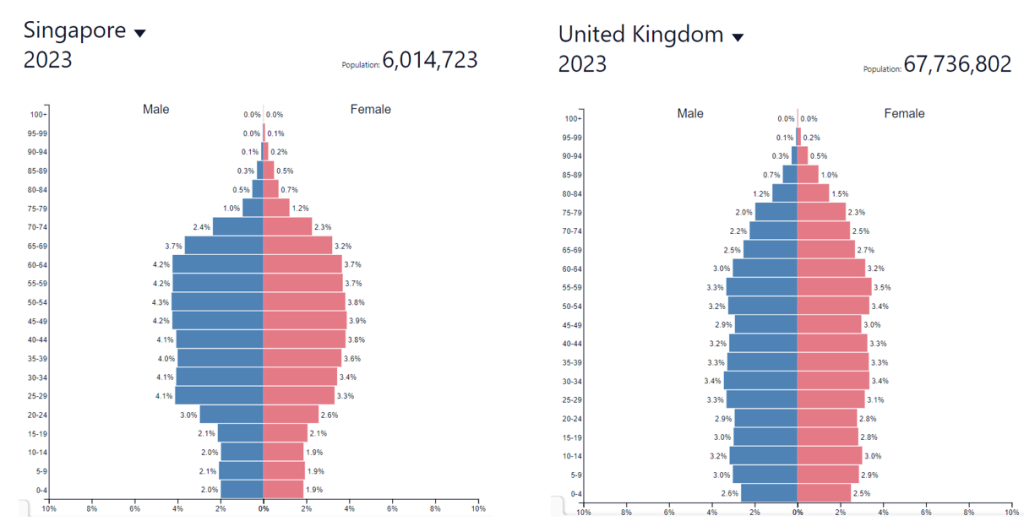
It seems quite a coincidence that the lag between people not attending hospitals in 2020 and the rise in cardiovascular deaths is so consistent between countries, despite different demographics. It might be expected that an older, frailer, more unhealthy population would see detrimental effects of a lack of healthcare sooner than a younger, fitter population.
Vaccination is clearly a possibility here that needs to be investigated.
The Singapore government report made no mention of vaccination with respect to deaths from any cause other than covid deaths.
They said “28% of COVID-19 deaths occurr[ed] in persons who were not fully vaccinated in the first half of 2022, even though only about 5% of the eligible population were not fully vaccinated in mid-March 2022.”
The government forgot to account for the healthy vaccinee effect, where people on the brink of death rejected the vaccine as they were dying anyway. Such an effect has been used to explain impossibly high estimates of effectiveness for influenza vaccines. The ONS and Statistics Regulator have both assumed this phenomenon exists. Members of HART have previously demonstrated that the proportion of people with multiple co-morbidities in the English population remained constant during the vaccine rollout. It is reasonable to assume that multiple co-morbidites were always present in the terminally ill but it may not be reasonable to assume that all people with multiple co-morbidities are terminally ill.
Note that the Singaporean government have used the phrase “not fully vaccinated” in this description. They do not define what they mean by that. In the first half of 2022 380.000 people had a second dose and 2,110,000 people had a third dose. The latter represents 39% of the Singaporean population. If the government were counting these people as “not fully vaccinated” then it is no wonder there were a large proportion of deaths among this group in the first half of 2022.
They make the claim that the excess deaths were only seen in people post covid infection.
“In a secondary analysis of persons without recent infection, no additional excess deaths were found.” This analysis and the data it relied on is not shared and I am not sure what an “additional excess death” is. Others have demonstrated that compared to a population having any random encounter with medical services, those who sought medical help for covid had a lower risk of cardiovascular disease and stroke.
Given the low numbers of infections with covid in Singapore in 2020 and the fact that there was no covid prior to September 2021, it is hard to reconcile that conclusion with this substantial increase in cardiovascular deaths.
So two unanswered questions remain, what role (if any) do vaccinations have in excess cardiovascular deaths? When will there be a full independent and transparent investigation?
