

Vaccinators have replaced priests at the bedsides of the dying
All HART articles also on Substack. Please consider a PAID SUBSCRIPTION so we can continue our work. Comments are open so you can join in the conversation.
It has become almost impossible to die in this country without first being injected. No longer is the priest by the bedside reading last rites, it’s the vaccinator.
The graph shows the percentage of adult deaths in England that were vaccinated for each month from December 2020 to the end of 2022, compared to total deaths in England.
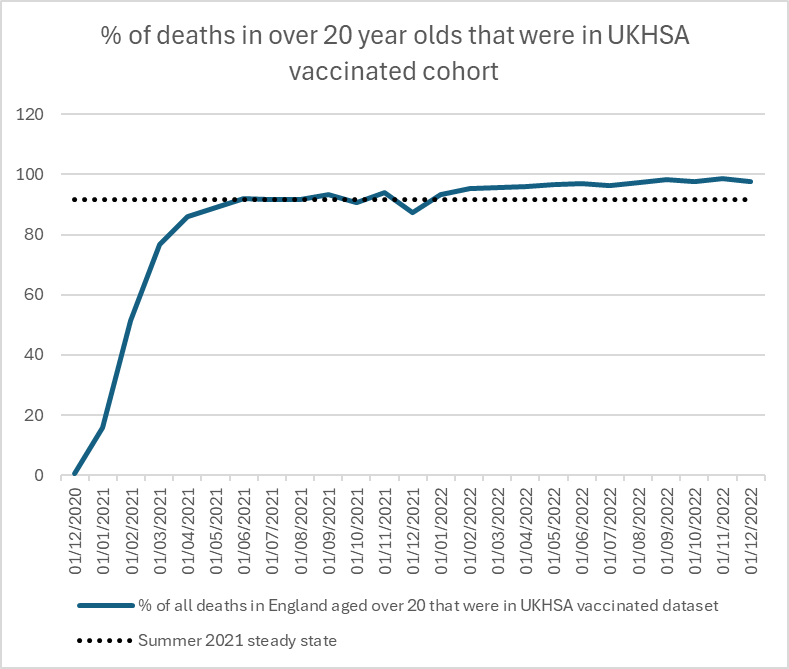
Figure 1: Percentage of deaths in England over the age of 20 years that were in the vaccinated cohort
Could this be covid? From 2022, there were more covid deaths in the vaccinated with omicron, so we would expect the overall proportion of deaths in the vaccinated to rise. However, this is all cause mortality, and the covid waves are not noticeable in this. Furthermore, the percentage of all cause deaths in the vaccinated had settled into a predictable pattern in summer 2021.
If only deaths in the unvaccinated are looked at there is a marked difference in 2022 compared to 2021. How can there be half the deaths in the unvaccinated in July 2022 compared to July 2021? By Autumn it was only a quarter.
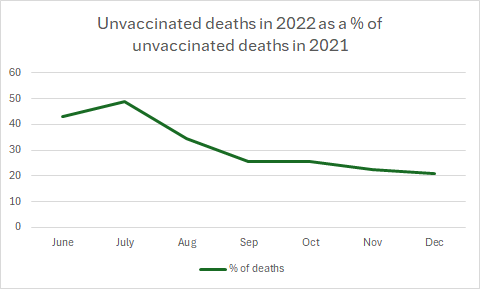
Figure 2: Percentage of deaths in unvaccinated in 2022 compared to 2021
Through summer 2021, the proportion of the population who were unvaccinated remained fairly steady and it seems people were allowed to die unvaccinated. But in 2022, as well as the vaccinated dying more, it looks like those susceptible to death had almost all been injected before dying.
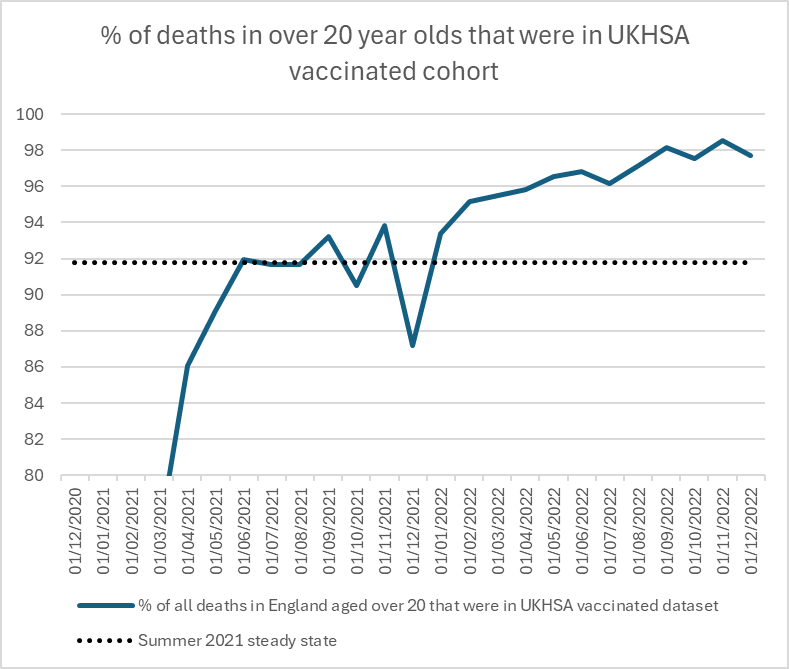
Figure 3 Percentage of deaths in England over the age of 20 years that were in the vaccinated cohort i.e. figure 1 but with zoomed in y-axis
Vaccinating the dying makes interpretation of any data on deaths almost impossible. To carry out a meaningful analysis data on only sudden deaths would be needed.
In the meantime, there are several points we do know that indicate the vaccines caused deaths. There was a stepwise increase in calls to ambulances for life threatening emergencies that happened with the rollout. There was no rise before. There was no rise after.
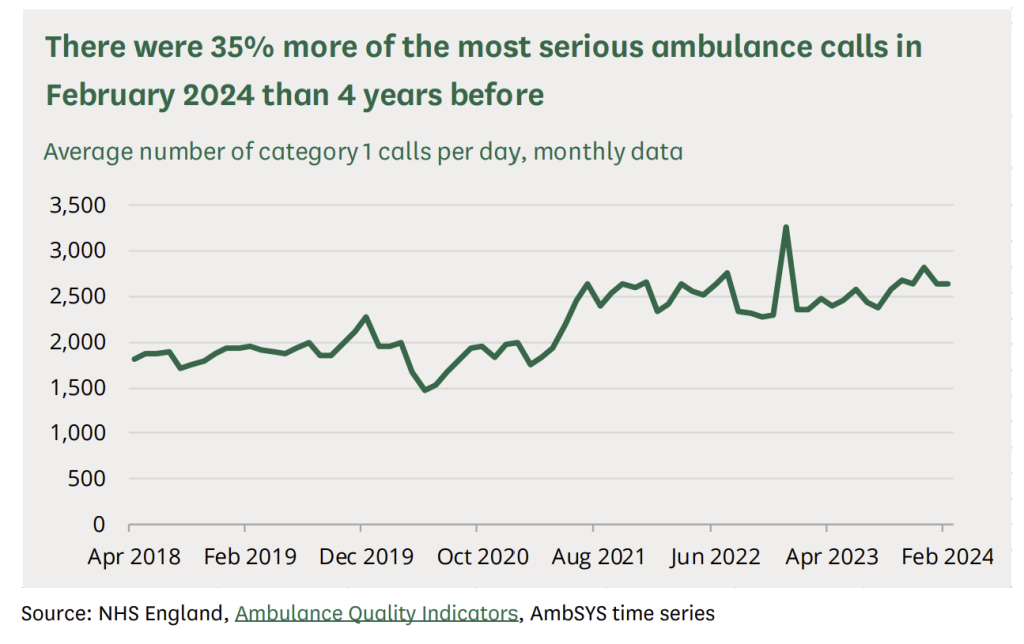
Figure 4: Life threatening calls to ambulances from gov data
After vaccination, during the Delta wave, more heavily vaccinated regions had a lower mortality.
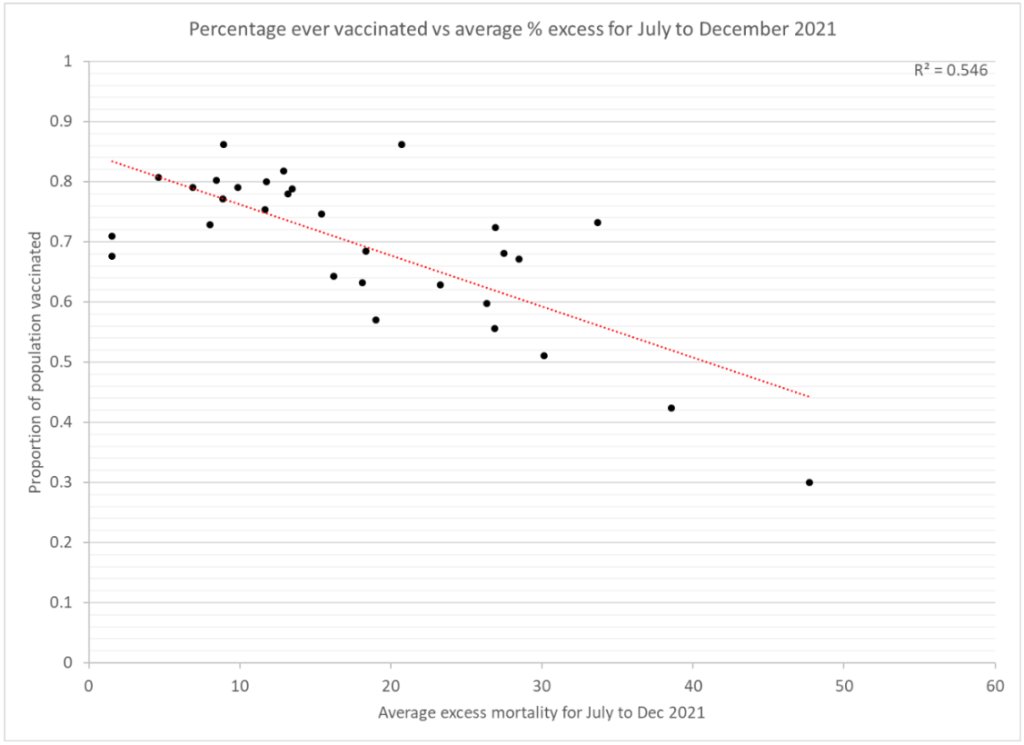
Figure 5: Eurostat excess mortality data for July to December 2021 plotted against proportion of each country vaccinated
However, this was also true BEFORE a single injection was given, suggesting it was due to confounders. The same was true for excess deaths as well as covid deaths.
With Omicron, the confounders were overrun and the relationship reversed.
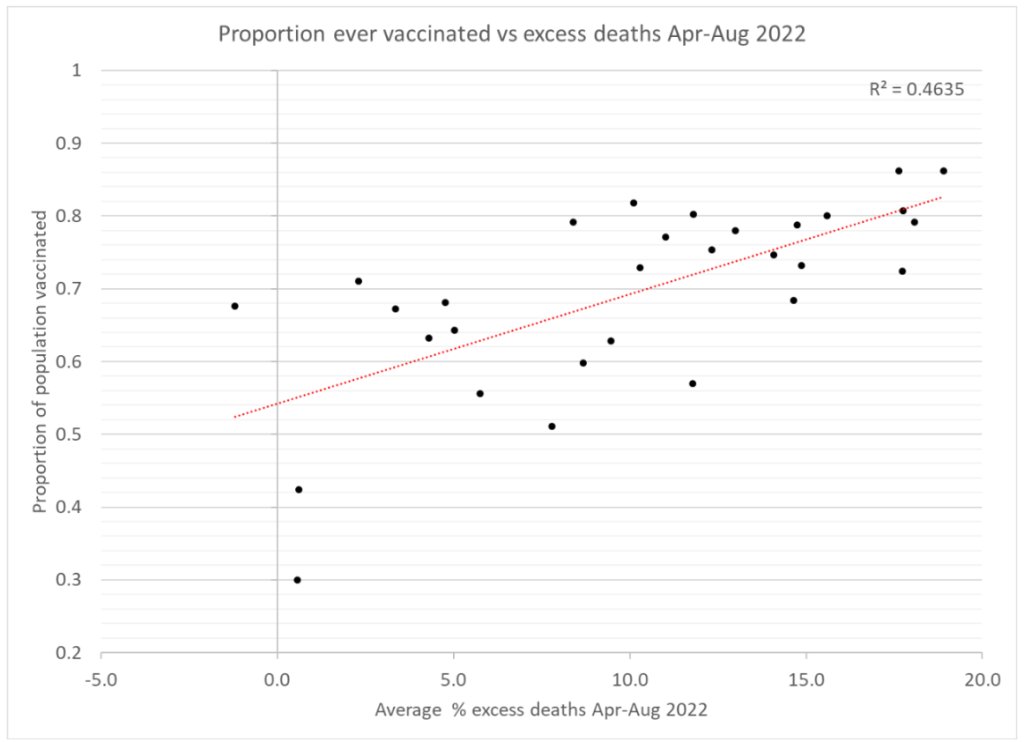
Figure 6 Eurostat excess mortality data for April to August 2022 plotted against proportion of each country vaccinated
At the same time as the rise in mortality, there was a rise in disabilities of people of working age. This happened from spring 2021 in the UK:
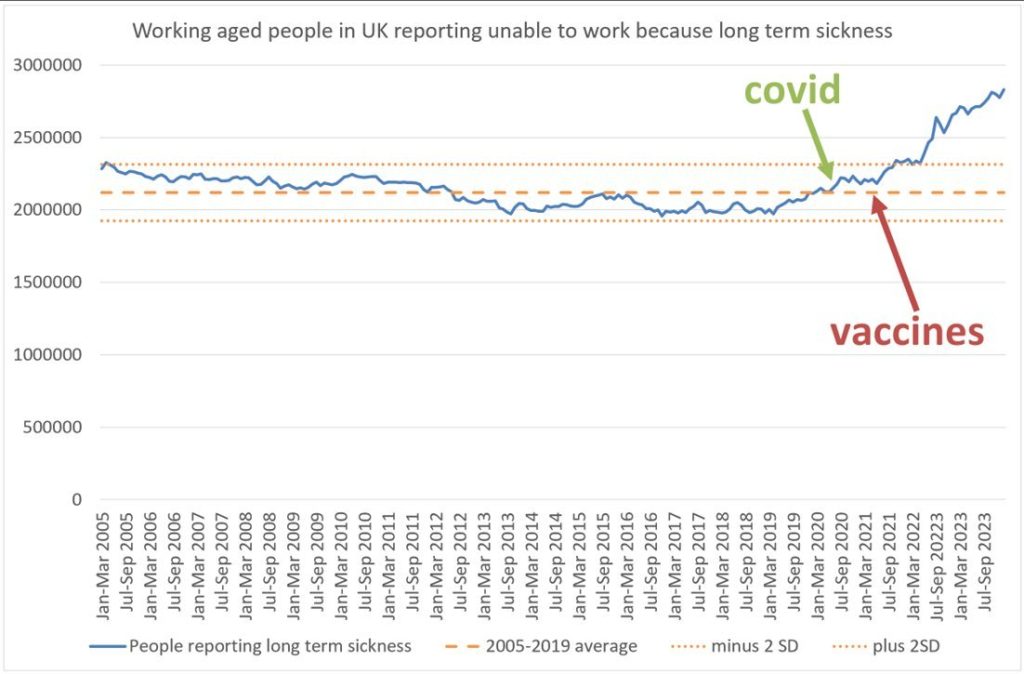
Figure 7 Working aged population in UK who reported, to a monthly ONS survey, being unable to work because of long term sickness
And in the USA:
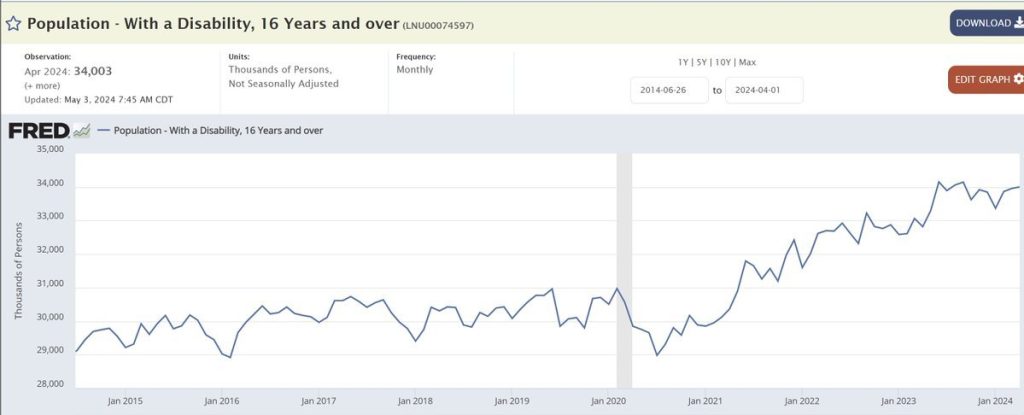
Figure 8 Proportion of over 16 year olds reporting a disability USA
It is these big picture measures that tell the story. It would be icing on the cake to have the detailed data too – and we will keep trying to get it.
