

Vaccination can’t be credited for all the changes
There are now two complete years of data since excess deaths first started to rise in Spring 2020. Therefore we can compare deaths over that time as well as comparing 2020 to 2021.
It was reasonable to expect a substantial deficit of deaths in 2021 for two reasons:
- The numbers of deaths of the most vulnerable in 2020 had been relatively high such that there would be fewer left to die.
- The burden of Covid was expected to be much lower because:
- The vaccination programme was expected to reduce mortality in 2021
- Doctors had a better idea of the best way to treat
- Mass testing was being carried out to protect the vulnerable
- The vulnerable were shielding
- Viruses usually become less deadly over time
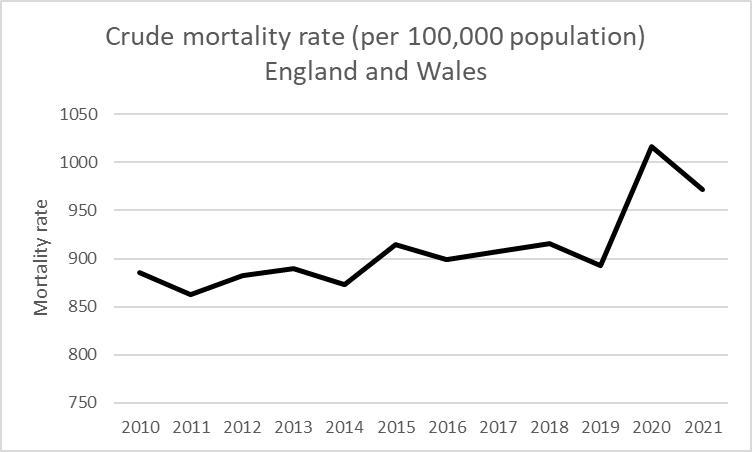
However, there were 585k deaths in 2021, which was 10% higher than the 2015-2019 average of 532k deaths. What is more there were over 2000 more covid attributed deaths in 2021 (76k) than in 2020 (74k).
In order to compare deaths over time it is important to account for the size of the population and the mortality rate per 100,000 people was significantly higher in 2021 than in previous years because of covid mortality. In particular, the higher deaths in 2021 were largely due to covid deaths in January and February during the winter 2020/1 wave when the majority were unvaccinated, and therefore an analysis of the overall effect of vaccination requires us to look more specifically at particular months.
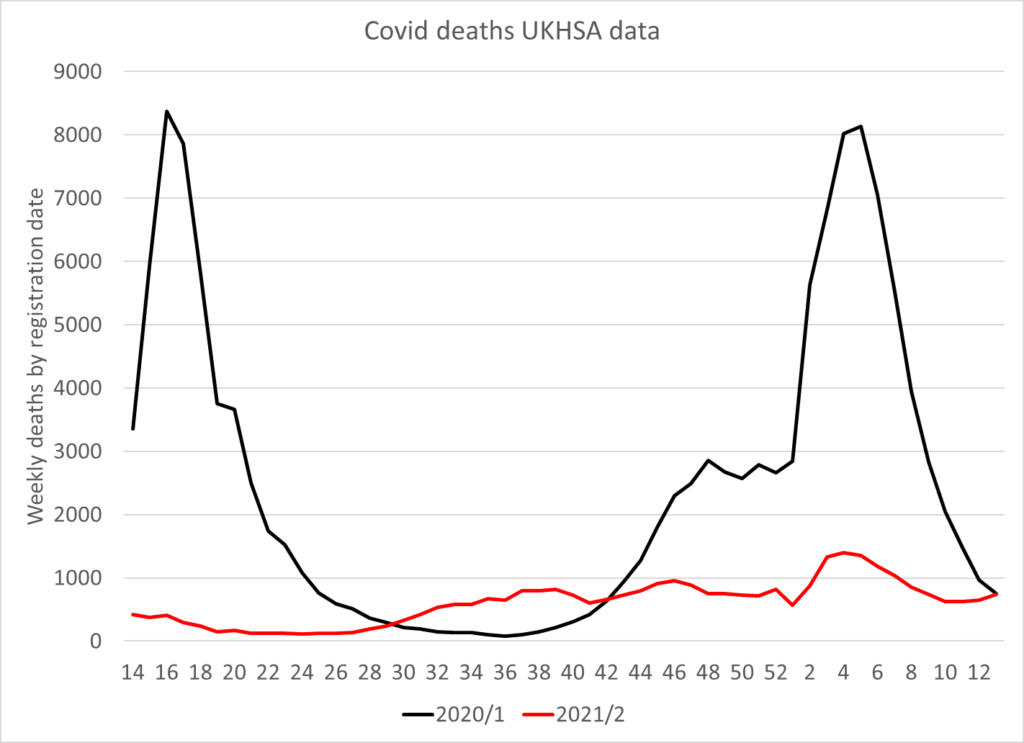
Comparing 2020 to 2021 (in their entirety) does not show a dramatic impact of interventions, though because of the January / February 2021 tail of the winter 2020/1 wave this is potentially misleading.
Comparing the first year of covid (Apr 2020-Mar 2021) with the second year (Apr 2021- Mar 2022) is therefore perhaps more instructive. This shows that the latter had only a quarter of the covid deaths, and on a simplistic analysis this reduction could be attributed to vaccination. Digging deeper however shows there are many other aspects to consider.
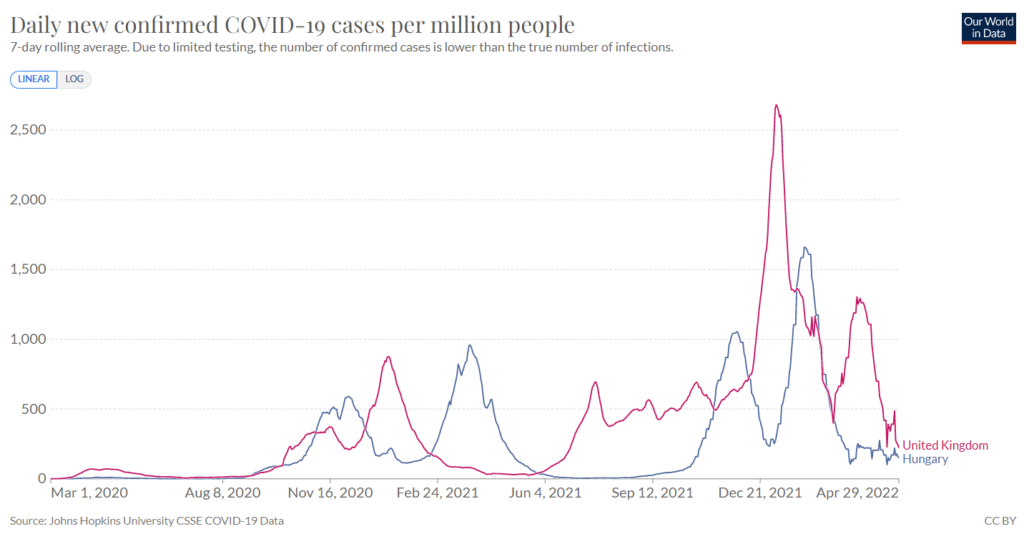
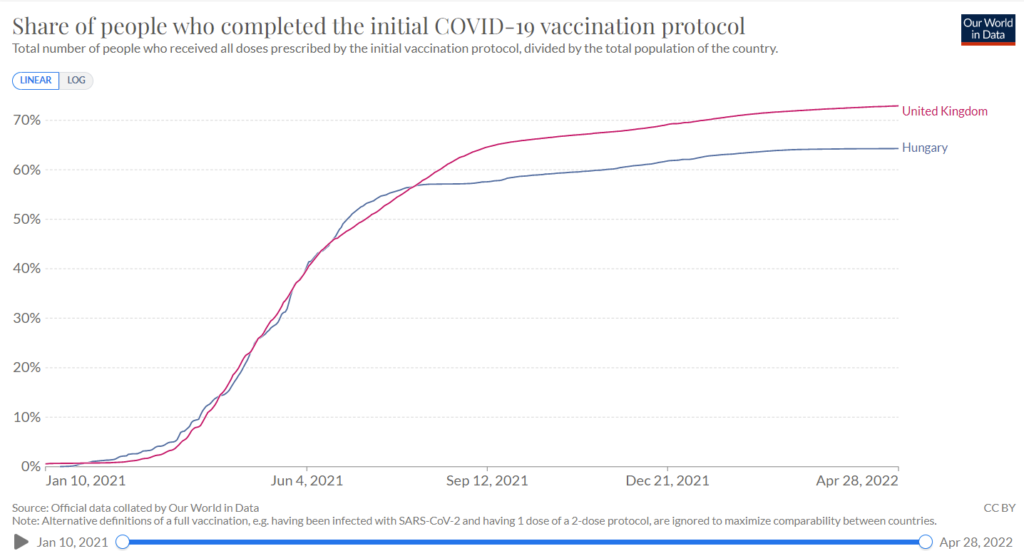
Each quarter is compared in figure 3. As expected, the first quarter after the arrival of covid shows a large spike in mortality with a marked high total death figure in the first wave which is absent from the same period in 2021. It is interesting to note that Eastern Europe had no covid in Spring 2020 during the time it was severe in Western Europe. When the relationship inverted in Spring 2021 this was attributed to high vaccination coverage in Western compared to Eastern Europe. However, this Spring has seen a return to the 2020 pattern with minimal covid cases in Eastern Europe; this is despite their lower vaccination rates.
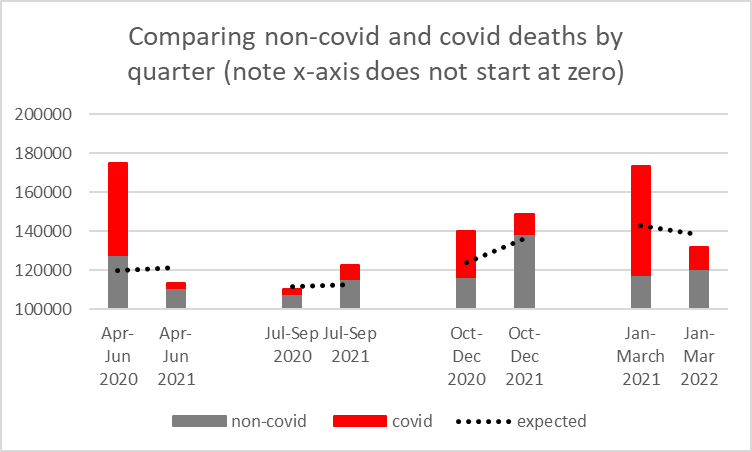
In the last 6 months of 2021, from week 27 to week 52 inclusive (July to December), there were 25k more non-covid deaths than the same period in 2020 in England. However, non-covid deaths were as high as the total deaths from the same period the year before.
It is arguable that vaccination may have reduced covid deaths during July to December 2021, with half the number than seen in the same period in 2020 (around 9,000 fewer). But there were 30,000 more non-covid deaths in the same period, a 13% increase on the year before, and 12% above expected levels. The rise in non-covid deaths in this period was not matched in the quarter before or after. For certain adverse effects the side effect profile is known to be higher in the young and from Spring 2021 vaccination was rolled out to younger age groups. Second doses were also given to older age groups in this period.
The dotted lines show the expected levels of death in each period according to UKHSA. There is little difference in three of the quarters but the expected levels were 10% higher for Oct-Dec in 2021 than 2020. It is not clear what the UKHSA based this higher expected level on.
The most recent quarter (Jan to Mar 2022) again shows a marked year on year reduction, which seems most likely to be due to the lower mortality rate seen with Omicron infection in 2022 than Alpha in 2021, as it has also been observed in many other countries with much lower vaccination rates.
In relation to attributing any benefits of reduced covid burden to any intervention, if the same reductions are seen elsewhere in the absence of that intervention, this surely raises questions that need answering. For example, it is to be noted that vaccination, which is said to have worked very well in Spring 2021 in Western Europe, failed in the same period in Eastern Europe; why? How much of the reduction in the latest quarter is because of Omicron rather than vaccination?
Finally, any impact of vaccination on non-covid mortality must also be considered, and the rise in non-covid mortality in 2021 compared to 2020 is concerning, especially within the context of an expected deficit in total mortality consequent to high previous mortality levels in 2020, reducing the number of vulnerable people in the population.
