
New measure suggests half the population
The Government has attempted to answer this question using a combination of antibody testing and the ONS household survey. The latter tests a random sample of the country each week to determine who is PCR positive and extrapolates to estimate the prevalence in the whole population. Unfortunately they fail to consider which of the PCR positive results are meaningful and which are weak positives from breathing contaminated air which would not translate into infectiousness or illness.
Using the ONS data, it is possible to calculate the number of positive results that were clustered in households – the infectious positives (see methods in appendix below).There is no data on the proportion of these that were symptomatic, which the ONS claims not to hold. Nevertheless, it proves to be an interesting measure of total covid prevalence.
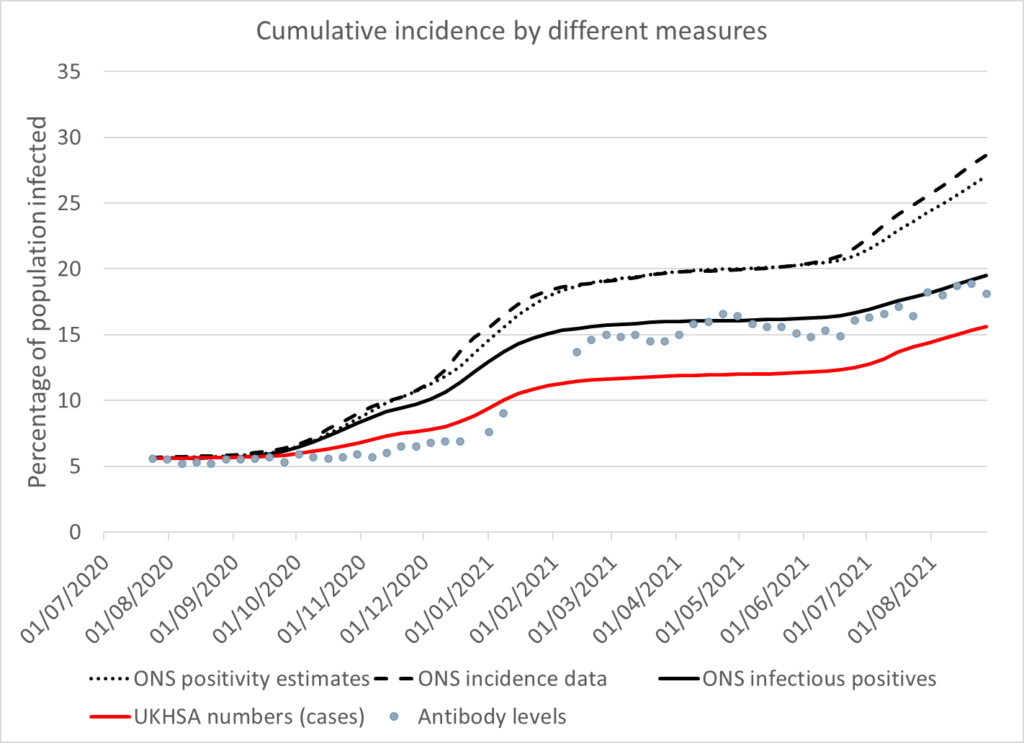
Figure 1 shows the ONS estimate of cumulative cases based on total positivity estimates for England (dashed black line) and also their daily incidence per 10,000 estimates (dotted black line). The ONS infectious positive measure is considerably lower than these measures but still in excess of the numbers diagnosed through Government testing (red line). It does however, correlate very closely with blood donor covid antibody levels (grey dots). It therefore acts as both a measure of transmissible positivity and infections which result in a protective specific immune response.
It is notable that the rise in blood donor antibody levels lagged the rise in cases significantly in Autumn 2020. By February 2021, the percentage with antibodies matched the percentage of transmissible infections. Examining the whole wave from June 2020 to May 2021 demonstrates a similar infection fatality rate to that seen in up to June 2020 suggesting the final measure was in fact accurate. It might be that the population of blood donors is not representative of the country as a whole. Some regions and socioeconomic subgroups were more likely to be infected earlier in the wave and blood donors may also behave in ways that reduce their exposure such that they avoid covid until later on in the wave.
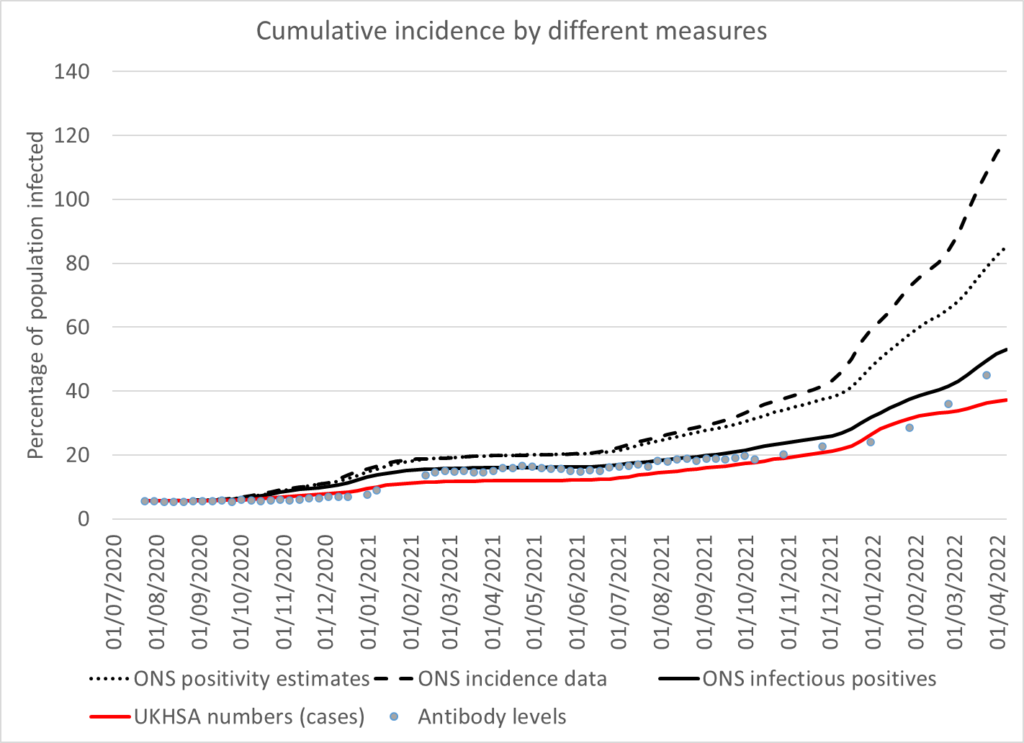
More recently a similar discrepancy has arisen between the ONS infectious positive measure and antibody levels, however, again it appears to be belatedly catching up. It will be interesting to see whether in the next month or two the antibody levels in blood donors start to match the ONS infectious positive measure again. In the meantime the estimates based on ONS positivity and ONS incidence, including positives not capable of transmission, have skyrocketed.
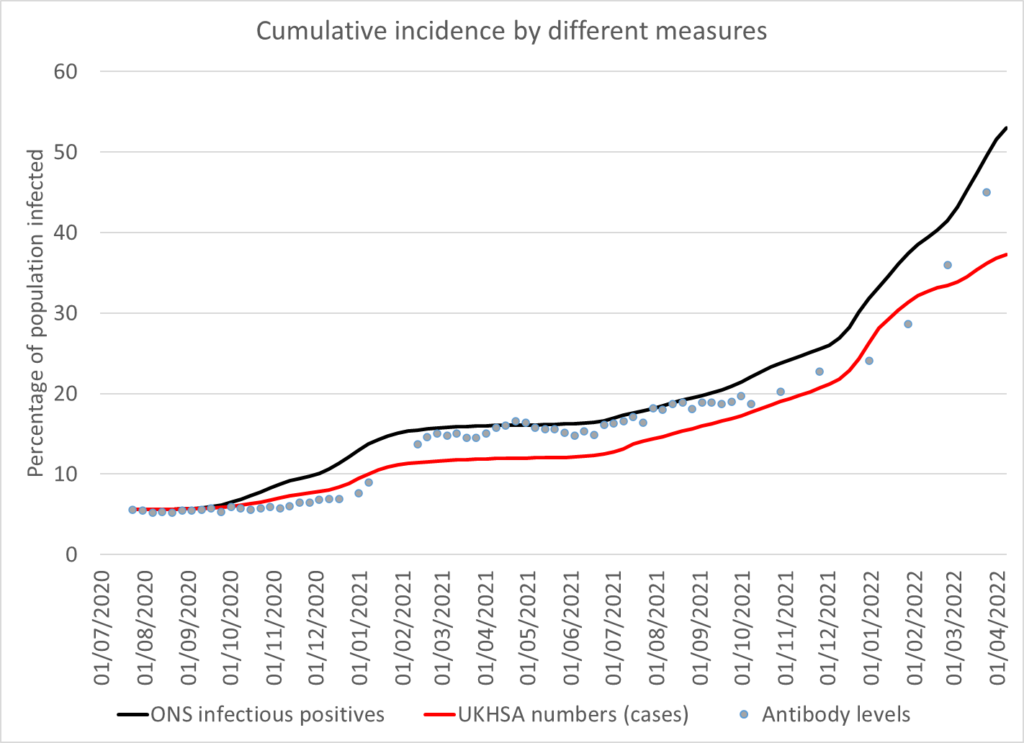
Using the ONS infectious positive measure, a consistent 80% of possible cases have been diagnosed through Government testing since September 2021 until March 2022 and falling to 70% in April 2022. There is therefore an apparent 20% of infectious positives identified in the ONS survey that are not picked up on testing in the whole population. The difference could hypothetically be due to:
- Symptomatic people declining testing
- Asymptomatic people with immunity where virus is detected but an immune response prevents the development of symptoms (with uncertainty about whether or not infectiousness was prevented).
It is not possible to distinguish between these situations without knowing the proportion of ONS infectious positives that had symptoms nor how strong their positive test results were.
There have been claims that the vaccinated do not produce the same post-infectious antibodies as the unvaccinated. There may be some truth in this but, after seeing a 26% rise in post infectious antibodies since summer 2021 in a heavily vaccinated population, it is clear that significant numbers of people remain capable of producing these antibodies.
UKHSA raised concerns that those who had been vaccinated twice would be less likely to develop antibodies to the capsule of the virus (N-antibodies) after an infection. If antibody levels do rise sufficiently to match the ONS infectious positive measure it seems that these concerns must have been over blown. If a vaccinated individual with detectable virus, does not develop symptoms or N-antibodies, is that not evidence of vaccination protecting them?
If vaccination were having a negative impact on the production of antibodies a difference would be seen among the antibody levels by age group because of differing vaccination rates. However, every age group shows a higher rise in antibody levels than the proportion of that age group testing positive over the relevant period (see table 1). This appears to be further evidence of the blood donors artifactually avoiding infections until the end of a wave.
| Antibody rise in blood donors from week 40 2021 to week 12 2022 according to UKHSA | Proportion population with positive test result from 1st Sept 2021 to 27th March 2022 | Proportion of population vaccinated | |
| 17-29 | 29.9% | 26.7% | 70% |
| 30-39 | 27.0% | 28.5% | 68% |
| 40-49 | 33.6% | 27.1% | 81% |
| 50-59 | 24.7% | 19.4% | 88% |
| 60-69 | 17.1% | 13.5% | 92% |
| 70-84 | 16.4% | 8.6% | 95% |
Conclusion
ONS data published on the number of households with more than one positive PCR is an indicator of infectious positives and can be used as a more accurate measure of total cases in the population. It correlates well with antibody levels suggesting it reflects not just infectiousness but also those infections which lead to protective immunity. The ONS’s own measures have reached incredibly high claims with well over 100% of the population having been infected by their incidence measure. Although unfortunate individuals have been infected more than once, these must outnumber people never infected for the ONS claim to be believable. ONS claims of prevalence include situations where individuals are never infectious, never symptomatic and do not develop protective immunity and consequently their estimates are overblown and do not reflect a useful measure of covid prevalence.
Appendix:
Methods for calculating ONS infectious positives
One thing the ONS can be praised for is their relative openness with their results and there is one datapoint they have published which can be used to estimate a measure of the numbers who have had infectious covid. Each week the ONS publishes the number of positive individuals in the survey but also the number of positive households. If we assume households are primarily made up of one or two people, then we can calculate the number of households with more than one positive person. This will be an overestimate because we have not accounted for households with multiple positive individuals.
Because the survey has expanded in size over time and to allow extrapolation to the whole population we need a denominator so a percentage of infectious households can be calculated. It is not reasonable to include all the tests done, as a proportion were in households with only one person, such that even if they were infectious there would be no way to measure that. The ONS have published that 30% of households in the country have only a single person. Assuming the ONS survey is representative we can adjust the number of tests done each week to exclude those carried out in single person households. The final measure is the proportion of positive test results in households with more than one person where there was evidence of transmission.
