

Why is the decline that stopped in four countries cited as proof that folic acid worked?
Dr Clare Craig
| Key points In every country cited as evidence that folic acid policy worked, neural tube defects had been falling for decades before the policy arrived. The decline did not accelerate when recommendations or fortification began. In most series it stopped. Either the rate would otherwise have risen, or it would have plateaued anyway, or it would have kept falling. The only way benefit can be claimed is if an assumption is made that the rate would otherwise have risen. Where birth defect registers counted terminations as well as births, affected births kept falling but affected pregnancies did not move. The assumption that more folic acid can only reduce neural tube defects is not biologically secure. |
In those countries most often cited as evidence that folic acid policy worked, neural tube defects had already been falling for decades before the intervention. When either recommendations or fortification began, the decline did not accelerate. In most of these countries it stopped. A decline might have been expected because of the affected babies that die when the mothers take folic acid. However, the decline is not seen.
If the intervention to recommend folic acid or fortify coincided with a plateau in the rate, which it did in USA, Canada, Europe, Australia and the UK, then there are three ways to interpret it depending on what would have happened to the rate without adding folic acid:
1. the rate would have reversed the decline and risen if there had been no intervention and the plateau is evidence that the intervention was a success
2. the rate would have plateaued anyway, in which case the intervention failed
3. the rate would have otherwise continued falling and the intervention was detrimental
England and Wales
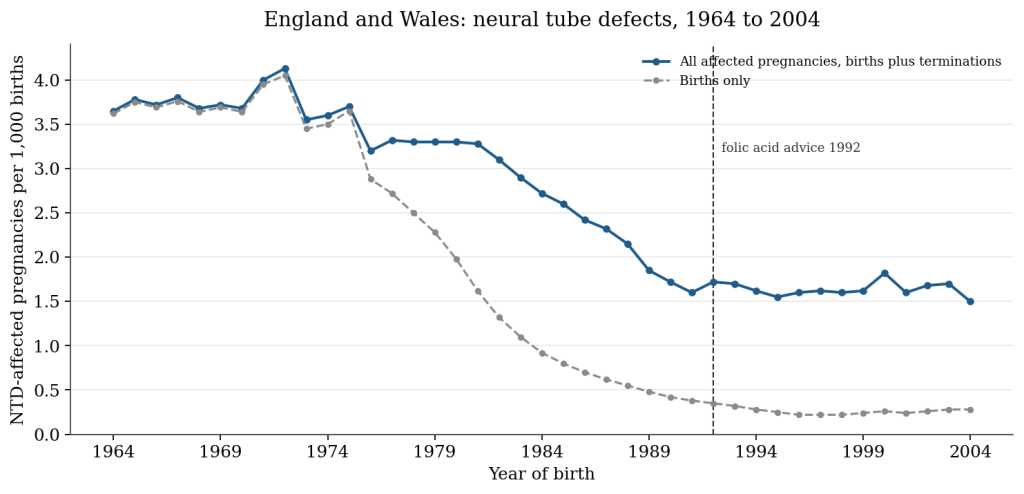
Figure 1: Adjusted total prevalence and birth prevalence, from Morris and Wald 2007. Annual points are read from the published figure and the termination count depends on an assumed 56 percent under-reporting correction.
In 1960s and early 1970s, the rate was around 3.6 to 4.1 per 1,000 births, then it fell sharply from about 1975. By 1990 it had reached about 1.6 per 1,000 and the decline stopped. Government advice to take folic acid was issued in 1992, two years after the plateau had begun, and from 1990 to 2004 the rate of affected pregnancies remained essentially flat.
Affected births fell much further, from about 3.6 to about 0.3 per 1,000. The gap between the two lines is termination. Fewer babies being born with a neural tube defect does not mean fewer pregnancies are affected.
United States
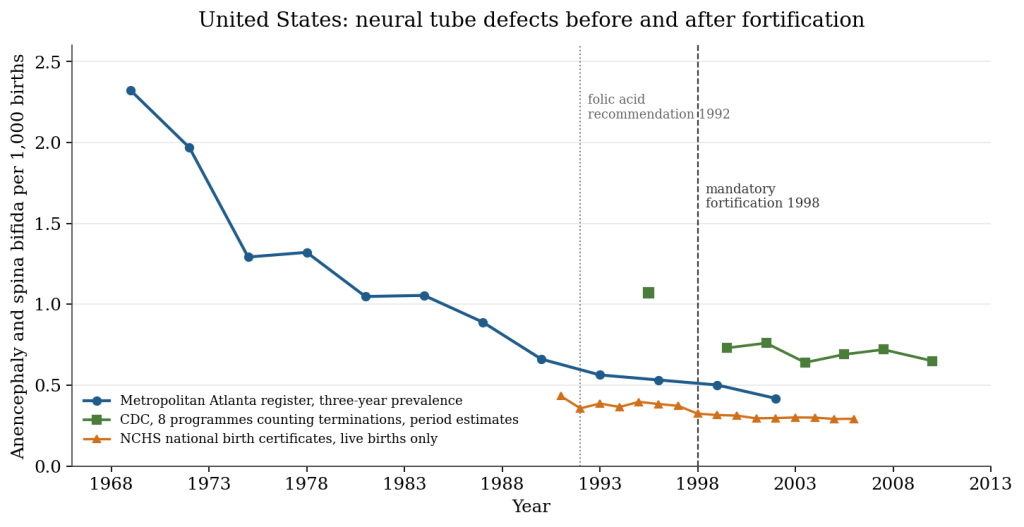
Figure 2: Metropolitan Atlanta three-year prevalence derived from Correa et al 2007, Tables 3 and 4. National birth certificate data from NCHS. Period estimates from the eight surveillance programmes that count terminations, from CDC 2015. The three series use different methods in different populations. Policy dates are marked based on the year of birth but conception obviously significantly precedes birth.
Metropolitan Atlanta has counted birth defects by the same method since 1967. Anencephaly and spina bifida together fell from 2.32 per 1,000 births in 1968 to 1970 to 0.66 in 1989 to 1991, a decline of 72 percent completed before the folic acid recommendation of 1992 and eight years before mandatory fortification. Across the full 36 year series spina bifida fell by 4.8 percent per year (95 percent confidence interval 4.1 to 5.5). The rate of decline did not change based on either the recommendation or fortification.
The national data have a further problem. The CDC used 1995 and 1996 as a baseline. Unless there was a massive drop in terminations over time, their claimed baseline is a noticeable outlier compared to the other data. The apparent fall was mostly complete by 1998, the year mandatory fortification began. From 1999 to 2011, all the data sources show no further decline.
Canada
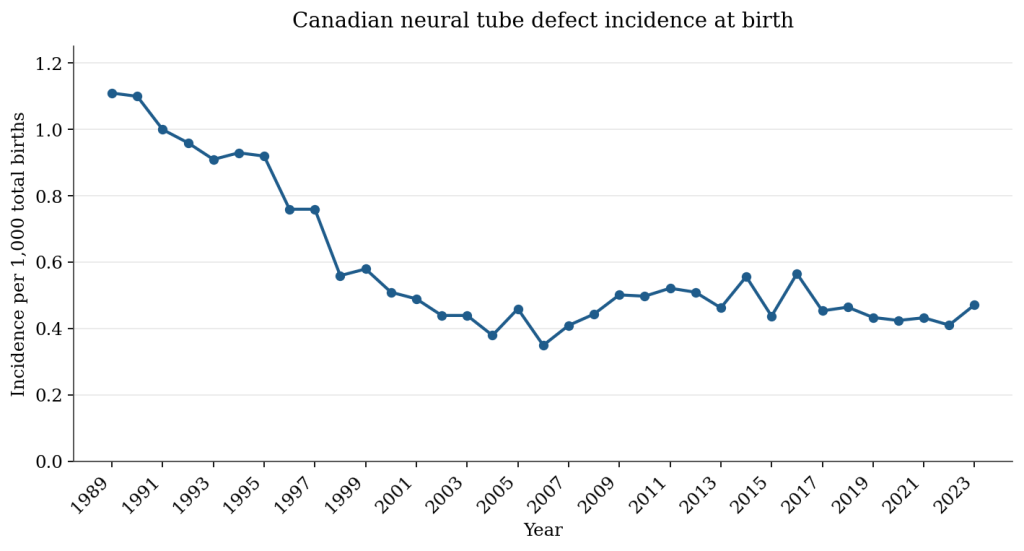
Figure 3: National surveillance, neural tube defects recorded at birth. Figures for 2008 to 2023 are from the CCASS data tool and earlier years from Health Canada, Congenital Anomalies in Canada 2002 and the Public Health Agency of Canada report of 2013. Terminations before 20 weeks are not counted.
The Canadian count at birth was already falling from 1989, from 1.11 per 1,000 births to 0.92 in 1995, before folic acid was added to anything. It then fell even more steeply to 0.56 in 1998, during the years when women were being recommended supplements and a few products were adding folic acid voluntarily. Fortification did not become mandatory until 11 November 1998, so 2000 was the first full year of births conceived after the mandate existed.
An Ontario cohort of 2.15 million live births was followed before and after fortification to measure the impact. After adjusting for maternal age, infant sex, neighbourhood income and neighbourhood education, the odds of a neural tube defect before fortification compared to after it were 1.06 (95 percent confidence interval 1.00 to 1.24 meaning the results were compatible with no actual effect). Spina bifida in that cohort fell from 0.47 to about 0.2 per 1,000 births. The authors recorded that the decline began in 1994 and was over by 1999. Anencephaly and encephalocele did not decline at all. Rates began rising again from 2007. The paper nevertheless concludes that fortification was successful.
Nothing has moved since. From 1999 to 2023 the series wanders between 0.35 and 0.57 with no direction, and the Public Health Agency of Canada describes the trend as stable across 2008 to 2023 at 0.48 per 1,000 births. The 46 percent reduction claimed for Canada failed to account for background declining rates.
Australia
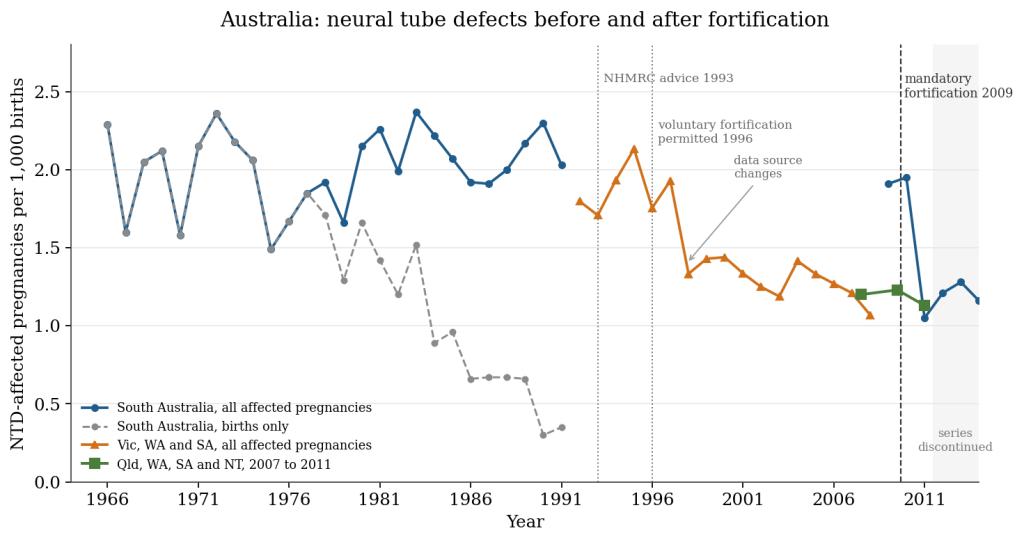
Figure 4: South Australia 1966 to 1991 from Chan et al 1993, and 2009 to 2015 from Flood et al 2013, the AIHW and the SA Birth Defects Register. Victoria, Western Australia and South Australia 1992 to 2005 from Abeywardana et al 2010, extended to 2008 from the AIHW. The 2007 to 2011 figures cover a different group of states. Within the orange series the years to 1997 come from summary data supplied by the three states and the years from 1998 from the national monitoring system.
The oldest dataset reports only on South Australia. It counted all affected pregnancies including terminations from 1966. Between 1966 and 1991 the rate did not decline at all, fluctuating around a mean of 2.01 per 1,000 births. Affected births over the same period fell 84 percent because of an increase in terminations, which were counted rather than estimated.
Data from Victoria, Western Australia and South Australia show a period of decline in affected pregnancies. In Western Australia, reported use of periconceptional folic acid rose from under 13 percent in 1993 to 30 percent in 1995 after an intensive campaign, and the registry recorded no reduction in neural tube defects over those years. Mandatory fortification did not begin until September 2009. After that date the annual figures, where data is available were 1.20 per 1,000 births in 2007 and 2008, 1.23 in 2009 and 2010 and 1.13 in 2011. The series then stops. Australia has not produced comparable national data since.
Europe
Twenty eight registries in nineteen countries report data, including terminations, to EUROCAT including 11,353 neural tube defects among about 12.5 million births between 1991 and 2011. The total incidence in 2011 was essentially the same as in 1991, at 0.91 per 1,000. Affected live births continued to fall with increased terminations.
What the plateau means
Looking at all these examples there is not one that shows that the decline increased once folic acid was introduced. Each of them shows a plateau in the rates. The fall in spina bifida was well underway before any folic acid intervention and this background fall was not always factored in when making claims about the impact of folic acid.
It is notable that the decline in cases was sometimes restricted to spina bifida. Rates of anencephaly, the rare condition of failed brain development, stayed constant in Ontario, in the American programmes without prenatal ascertainment and in South Australia across thirty years. If folic acid worked why did it reduce one neural tube defect but not the other?
Could the rate have started rising in the absence of folic acid? There is an argument that rates may have risen due to rises in maternal obesity and diabetes. The risk of a neural tube defect in obese mothers is almost double (odds ratio of 1.87) and obesity among women aged 16 to 44 in England rose from about 12 percent in 1993 to over 19 percent in 2013. That might have caused a rise in neural tube defects of about 5.5 percent. Pre-existing diabetes adds about 1 percent more. Even at a stretch this six percent cannot explain the end of what was a steep decline in incidence.
The second possibility is simply that the long period of decline reached a floor and would have flattened anyway. If so, that does not support the idea that folic acid had an impact.
The third possibility, that a continuing fall was halted because of negative effects of folic acid cannot be ruled out biologically. Mouse experiments have shown that the effect of folic acid depends on genotype of the mouse and dosage. In certain genetically susceptible lines folic acid increased neural tube defects. Other mice had a protective effect at moderate folic acid levels which disappeared at higher levels. It is not known whether there are human genetic differences where for some folic acid could increase the risk.
Any claim of folic acid benefit needs to address these three counterfactuals.