Covid death diagnosis has improved since overdiagnosis in autumn and winter
There is increasing debate about the accuracy of covid admissions, with talk of “incidental” covid patients who are in hospital for another reason but happen to test positive. This would mean that should the patient subsequently die, this might be attributed to covid when this was not the cause of death. Thus this potential inaccuracy will pollute covid death statistics and policy decisions. Death certification involves human judgment and there will have been times when a doctor couldn’t prove that covid led to death but could not disprove it either. Likewise, given that the death had already been recorded as a covid death by the Government, it would be difficult for a doctor to exclude it from the death certificate without compelling evidence that it did not contribute to death.
Death diagnosis is an art as well as a science. A doctor must collate all they know about the patient, weigh up the evidence, decide that the death was natural and then arrive at an explanation for their death that best fits the evidence. Because covid has been defined not as a characteristic group of symptoms but as a positive test result, there are very few symptoms which cannot be attributed to covid. An incidental positive test result can therefore have a disproportionate impact on how a doctor describes a death.
One doctor told me of an incident where a man died in the emergency department from a massive brain haemorrhage as a result of a burst aneurysm. When he came to relieve the doctor after his night shift, he asked him to do the death certificate. In his exhausted state he responded, “but we haven’t got his covid test back yet.” Deaths from bursting brain aneurysms should not be attributed to covid, even if a patient tested positive and even though covid can affect clotting. No matter how good your clotting ability is, it will not save you from a massive burst brain aneurysm.
There remains controversy around whether covid deaths were overdiagnosed in winter 2020/21. Conversely others have claimed that a lack of testing led to underdiagnosis in spring 2020. If there had been no testing for SARS-CoV-2 there would still have been indicators of higher than expected deaths with a clear pattern towards deaths from acute respiratory infections (ARIs) and circulatory deaths. Deaths where ARIs were recorded on the death certificate can be used as a surrogate marker for covid deaths.
Covid can kill due to clotting issues and septic shock as well as from pneumonia. Establishing the proportion that die from each mechanism provides a baseline for covid deaths from which overdiagnosis or underdiagnosis of covid deaths can be estimated. One study of 26 autopsies showed that 54% of covid deaths had an associated pneumonia. These deaths would be likely to have mention of an acute respiratory infection on the death certificate, whereas deaths from other mechanisms including septic shock or blood clots may not. As this is a very small sample it may not be possible to extrapolate from it and doctors’ decisions regarding certification may add additional bias.
UKHSA publishes a weekly report providing a value for the number of excess deaths which it defines as death registrations above the 2015-2019 average for that week. They do not state that they are using a different baseline for 2020, however, their estimated deaths for the second week of the year in 2022 was 13,970, whereas for the equivalent week in 2021 the estimated deaths figures was 12,460. This suggests they have included the high death figures from 2021 as part of the baseline for 2022. The result is that the 2022 death figures, despite approximating expected levels from 2015-2019 are recorded as showing far fewer deaths than expected – negative excess deaths.
Arguments have been made that in spring 2020 covid deaths were overdiagnosed. For the remainder of this paper the assumption is made that these deaths were accurate. It allows a starting point and shows relative changes, even if absolute numbers are not accurate. If deaths were overdiagnosed in spring 2020 then all the subsequent inferences can be scaled down.
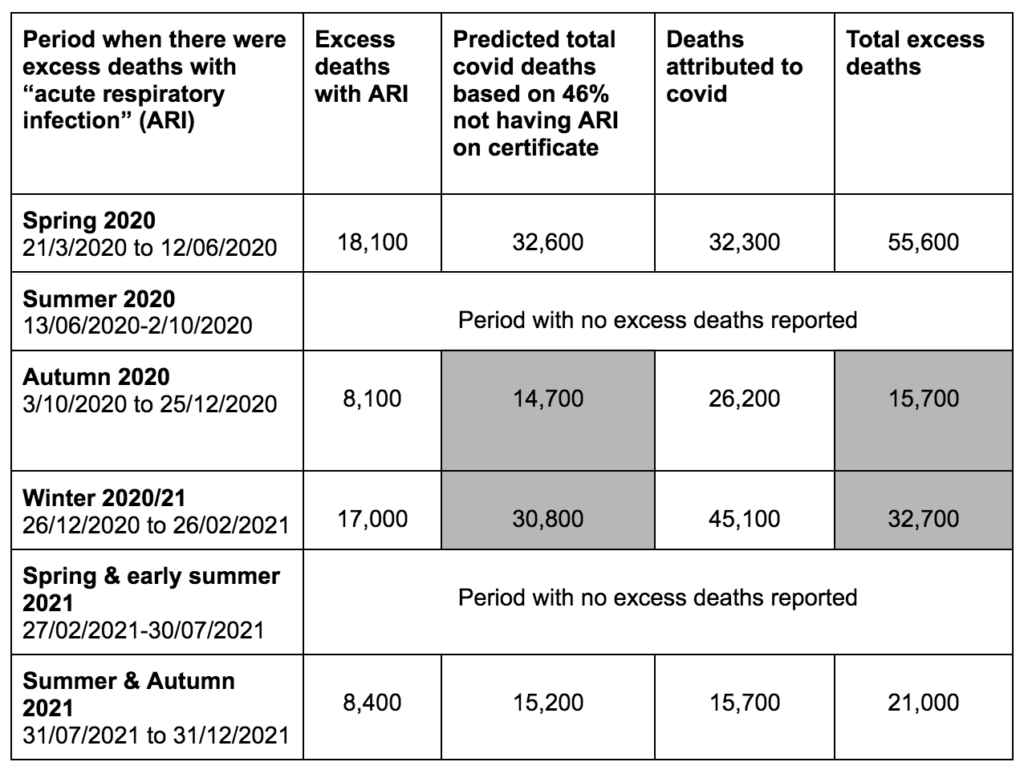
If we make the assumption that covid death diagnosis in spring 2020 was accurate, then the proportion of covid deaths that were labeled as excess ARI deaths would be 55%, very close to the 54% from the post mortem study. Using this 55% figure we can extrapolate an estimate of total covid deaths from the excess ARI figure and see how later periods compare. Total covid deaths in the last 5 months of 2021 match very closely with this figure. It is also a very close match for total excess deaths in autumn 2020 and winter 2020/21 as well as for the last 5 months of 2021.
However, this estimate does not match actual deaths that occured in spring 2020 and autumn and winter 21/22. Firstly, the total excess deaths in spring 2020 cannot be accounted for by covid alone. Secondly, the total covid deaths in autumn and winter 2020/1 far exceeded the number estimated based on acute respiratory infection deaths. In autumn 2020, only 31% of covid attributed deaths were excess acute respiratory infection deaths and in winter 2020/21 the figure was 38%. Was this because of overdiagnosis of covid as the cause of death? If covid was not overdiagnosed in those periods then we must identify why excess acute respiratory infection deaths significantly fell as a proportion of covid deaths for that period, before returning to the previous ratio.
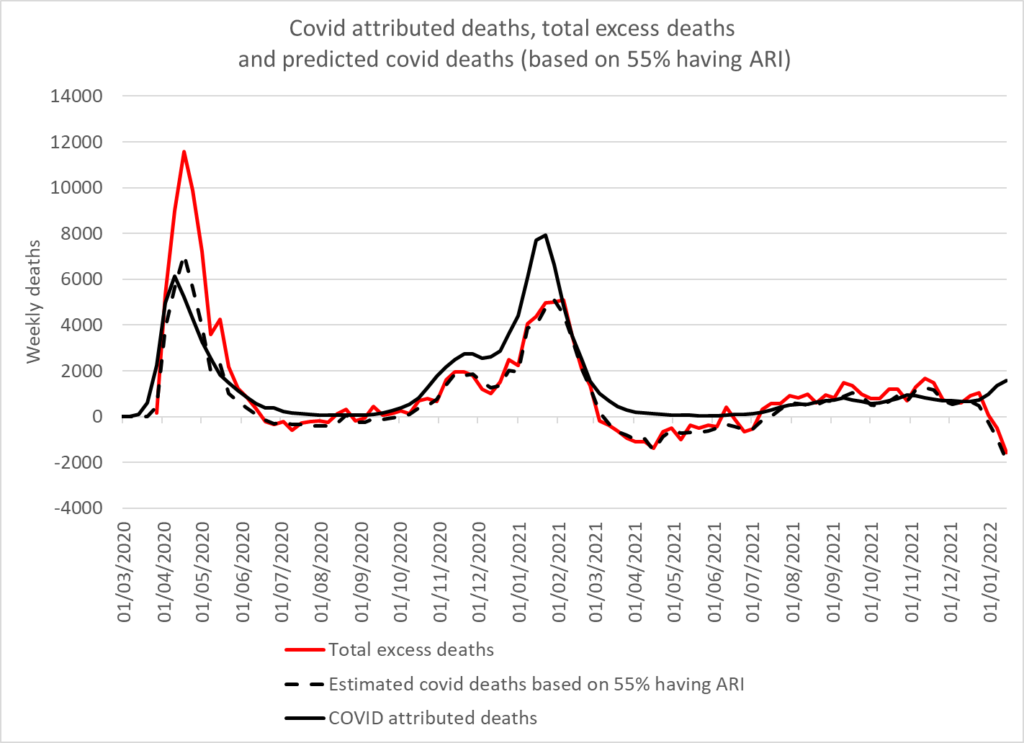
Ignoring the periods where there were no excess deaths and comparing each wave, shows that the predicted covid deaths using this model are a very good fit for total covid attributed deaths, being within 2.7% in spring 2020 and 1.3% in the last 5 months of 2021 (see table 1). Unless there is currently underdiagnosis of covid, that suggests that deaths were not underdiagnosed in spring 2020. However, the covid attributed deaths were 75% more than estimated in autumn 2020 and 44% more in winter 2020/21.
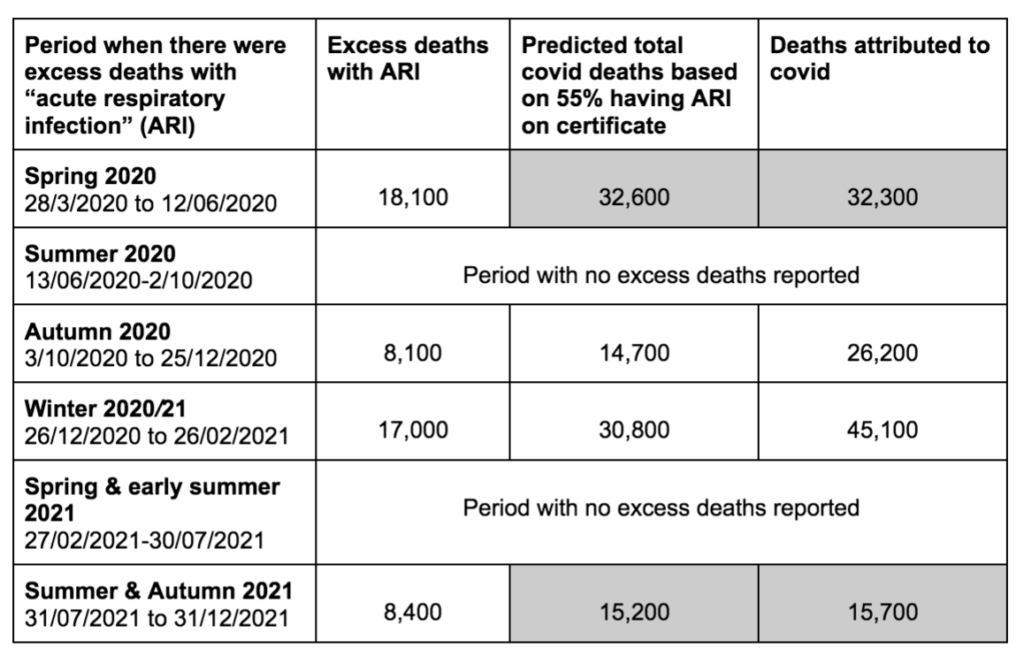
Although total covid attributed deaths are a bad fit for the predicted covid deaths in autumn and winter of 2020/21, this is not the case for excess mortality. The predicted covid deaths are within 4.0% and 4.5% of the total excess deaths in this period (see table 2). The same cannot be said of excess deaths in spring 2020 or more recently. In spring 2020, there were 65% more total excess deaths than predicted covid deaths and in the last five months of 2021 there were 35% more.
There are several possible explanations for non-covid excess deaths in spring 2020 including:
- Intensive care units were emptied and people who normally would have qualified for a bed were denied treatment;
- People who needed healthcare were turned away and told to isolate – the Oxford coroner reported on preventable deaths occurring in this way;
- Others did not access healthcare when needed, due to fear either of catching covid or of being alone in hospitals where no visitors were allowed;
- Lack of care home and hospital staff, including ambulance and emergency department staff, because of covid related absences;
- Lists were drawn up of patients who were not to be taken into hospital;
- Do not resuscitate orders were handed out to otherwise healthy people with learning difficulties and the elderly.
Whatever the ethics of the above decisions, given our limited understanding of how stretched health services would be, it is hard to argue these events would not have led to excess non-covid deaths.
The excess non-covid deaths that have been seen in the last 5 months of 2021 need further explanation. The excess has been seen in vascular causes of death. The excess deaths seen in over 65s could be explained by covid deaths. However, the under 65s have had excess non-covid deaths. Care home and hospital staffing may have played a role as before. For the 25-49 year old age group, excess non-covid deaths were evident in autumn 2020 and psychological stress, as a result of government policies, leading to heart disease is a possible explanation. However, for other age groups the non-covid excess deaths began in spring 2021 and the possibility that there is a connection to the covid vaccination needs investigation.
