

More data to back up myocarditis concerns
There are two key points regarding post vaccination heart issues that HART have been raising concerns about since early 2021.
- Myocarditis is attributable to injection not infection
- What has been diagnosed may represent wider harm that is yet to be properly measured
Data from multiple sources now concur on important points. However, there is data from England which appears contradictory.
It’s the injections not the infections that cause myocarditis
Many people have claimed that it is the virus that is the underlying cause for myocarditis rather than the vaccinations. There are several ways to check this hypothesis. The obvious one is to compare the rate of myocarditis after infection in:
a) uninjected uninfected
b) uninjected infected
c) injected uninfected
d) injected infected
Although there have been several epidemiological analyses of myocarditis, that simple comparison is never made. Where uninjected people are looked at specifically, there is no evidence of an increase in incidence. HART has previously summarised the data after infection in the injected compared to the uninjected.
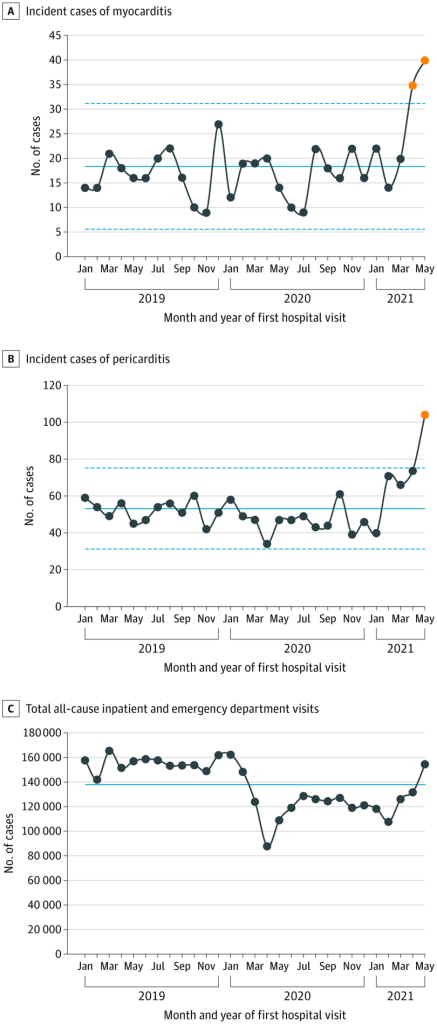
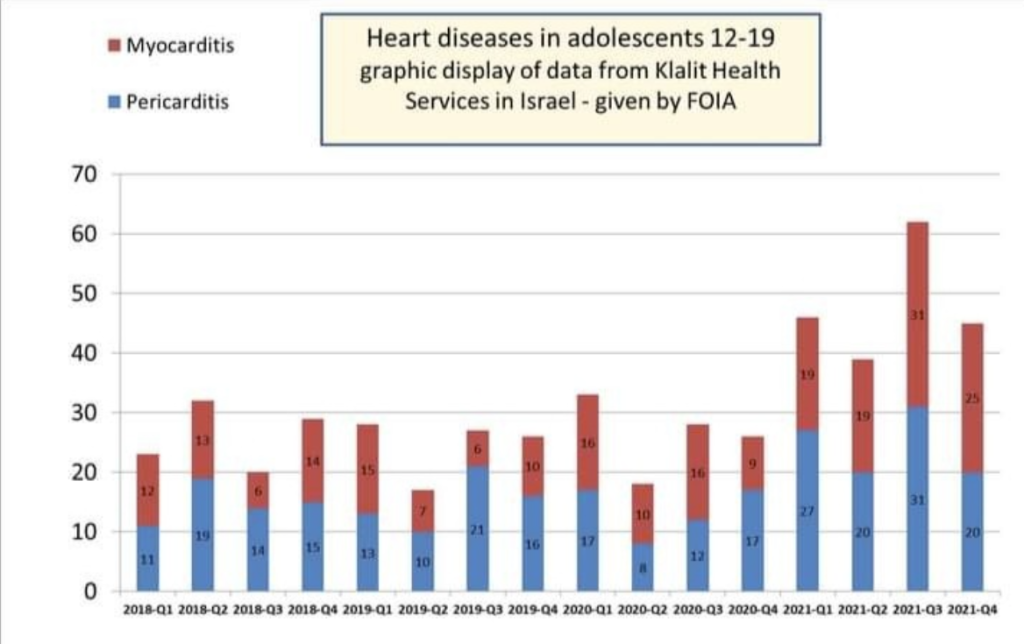
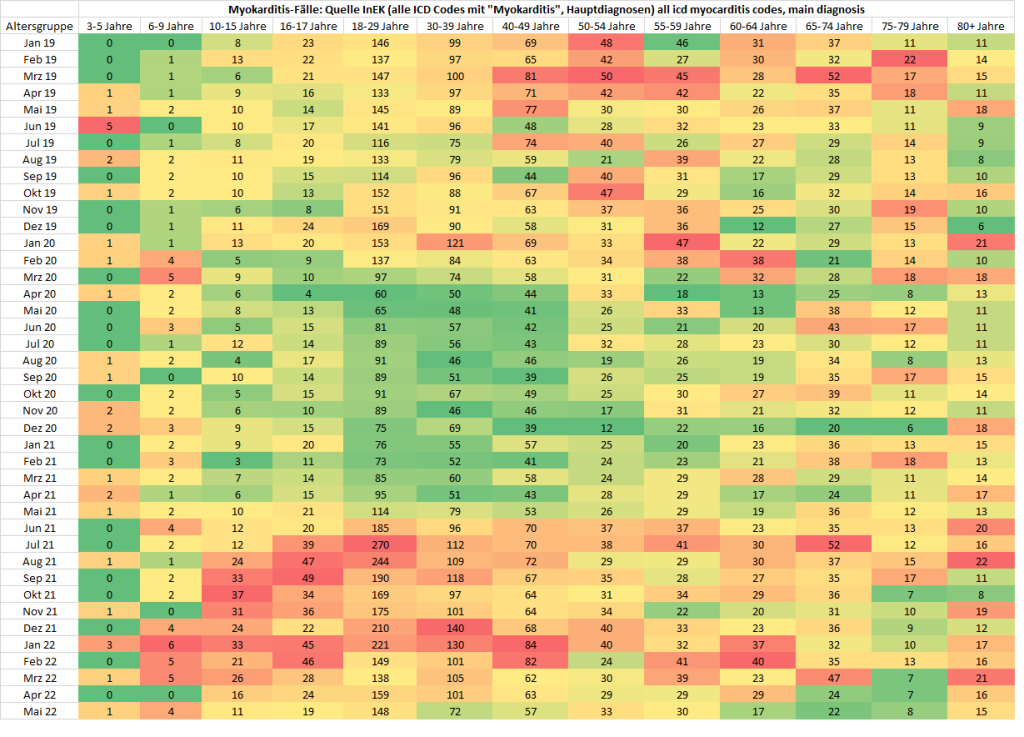
An alternative approach is to look at how common myocarditis is over time. Did the incidence increase with the arrival of covid in 2020 or the arrival of injections in 2021?
There are now several sources of data to answer that question and they all concur.
- A study of 40 US hospitals
- An Israeli FOI
How much overall harm has been done to hearts?
Has measuring patients hospitalised with myocarditis and pericarditis been looking only at the tip of an iceberg in terms of harm to the heart? Myocarditis and pericarditis are caused by inflammation of the heart and the layers of tissue that surround it. It is not known how much of this occurs after injection due to misdirecting the immune system to attack the heart or due to cells being destroyed because they have been damaged or are expressing spike protein.
A heart-wide inflammatory process would lead to symptoms and the possibility of a diagnosis in hospital. However, a less severe effect on only part of the heart may not be apparent unless it is looked for. Indeed, at post mortem in a post vaccination myocarditis death of a 22 year old, scattered single dead cells were seen as well as clusters of more significant damage and inflammation.
Why would it matter if someone doesn’t even get symptoms? The issue is that the cells of the heart cannot be replaced. What is worse is that when the cells are killed they leave behind a scar which means that the electrical circuitry of the heart can short circuit causing a sudden cardiac arrest in future.
Attempts have been made to measure the extent of this hidden damage in teenagers. Damage was measured through asking about symptoms, doing an ECG to measure the electrical pattern of the heart and doing a blood test to look for a rise in an enzyme that dead heart cells release, troponin. Table 1 sets out the findings from three studies. Both Thailand and Taiwan demonstrated a significant number of children who experienced cardiac symptoms after the injection. The Taiwan study did not systematically test for troponin in the blood, only testing 33 of the children of whom one had an abnormal level.
| Thailand13-18 yr olds Mean age 15yrs | SwitzerlandAdult uni employees Mean age 37 yrs | Taiwan12-18 yr olds Mean age 16.7yrs | |
| Cardiac symptoms | 29% | N/A | 17% |
| ECG changes | 18% | N/A | 1% had changes not seen on initial ECG which was after first dose |
| Troponin | 3%(of the males) | 2.8% (where no other cause could be attributed) | 1 of the 33 who were tested = 3% |
All three studies demonstrate a far higher rate of subclinical harm from injection than the rate measured when only looking at hospitalisations that result in a myocarditis or pericarditis diagnosis.
Given the notable rise in cardiac deaths seen recently there needs to be an investigation of the possibility that heart damage after these injections has led to scarring in hearts causing sudden cardiac deaths.
The Contradictory English data
In light of the above there are two sources of English data that look odd and seem to contradict each other. The first is an epidemiological study from Oxford and the second ONS data on cause of death.
The Oxford study looked only at 43 million people who were injected in 2021 and identified how many had myocarditis and pericarditis after injection and after infection. They are not explicit about deaths but by subtracting table 7 (1) in the supplementary material from table 3 in the main paper it is possible to find the number of deaths.
| Within 28 days of injectionAstraZeneca | Within 28 days of injectionPfizer | Within 28 days of injectionModerna | Within 28 days of positive test before injection | Within 28 days of positive test after injection | Not within 28 days of infection or injection | |
| Number only hospitalised | 179 | 279 | 59 | 111 | 52 | 1961 |
| Number deaths | 51 (22%) | 49 (15%) | 0 | 3*see caveat | 29 (36%) | 220 (10%) |
| Total hospitalised or died | 230 | 328 | 59 | 114 | 81 | 2181 |
* Caveat: Note that the definition for a myocarditis death was that it occurred within 28 days of hospitalisation for myocarditis or was included on the death certificate. However, because the study only included people who had been injected, those who died uninjected and then never had the injection would not be included in the data. It is also noteworthy that three people who had tested positive were vaccinated, diagnosed with myocarditis and died all within 28 days.
The data is unrepresentative because anyone who had an episode of myocarditis after the first injection was excluded if they had a subsequent episode. Those most likely to be at risk of myocarditis after infection, i.e. anyone who had myocarditis after injection and was then infected were excluded from the post infection data. If the covid infection rate was similar to the whole population (6.9%) in the group who had myocarditis after injection then of the 517 people who were hospitalised with myocarditis after injection a total of 36 would be expected to have gone on to get an infection after their injection. If those 36 had a second hospitalisation for myocarditis after infection that would make the total not 81 but 117 – i.e. a similar level to the uninjected.
The authors used modelling to account for the seasonality of covid infections. After modelling they concluded that the rate of myocarditis was twice as high in those infected before injection compared to those infected afterwards. However, the raw data shows 114 incidents of myocarditis among 2,958,026 infections before injection (38.5 per million) and 81 incidents of myocarditis (which is likely undercounted) among 2,976,127 infections (27.2 per million). To double the rate seen in the raw data due to such modelling is fantasy science.
Looking at the study as a whole, for all of 2021, there were 100 deaths which occurred within 28 days of a dose of injection. It is hard to know the total number that occurred within 28 days of a positive test result but it seems a stretch to conclude from this study that it would have been higher than that. Of all the deaths in the study 28% of them happened within 28 days of a covid injection. Likewise there were considerably more hospitalisations within 28 days of injection than within 28 days of infection.
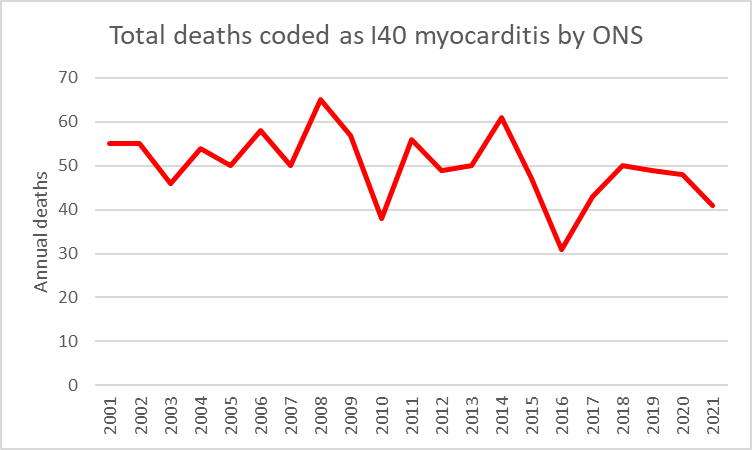
A death within 28 days of a hospitalisation for myocarditis is quite a broad definition for death. The Oxford team do not share how many of these deaths had myocarditis mentioned on the death certificate. In contrast, the ONS published data where every death from 2001 was reduced down to a single diagnostic code using a computer algorithm. For those deaths coded as I40, which represents all non-bacterial causes of myocarditis, there was no rise. In fact there were only 41 deaths for the whole of England and Wales coded in this way according to the ONS. That stands in sharp contrast to the 352 deaths reported by the Oxford study in a sample of three-quarters of that population.
Conclusion
Despite attempts to blame myocarditis on infection it has clearly risen in incidence only on arrival of the injection programme. Other evidence suggests the incidence after infection seems to be higher in the injected than the uninjected. As always with covid the story is in the data that has not been shared. The Oxford group has access to information on the myocarditis rates in the unvaccinated population and also the rates in 2020 before the rollout and has, again, failed to share them. In the meantime, data on subclinical heart damage that could lead to long term negative outcomes keeps accumulating.
