
Keeping data hidden from the public… for whose benefit?
All HART articles also on Substack. Please consider a PAID SUBSCRIPTION so we can continue our work. Comments are open so you can join in the conversation.
This article was written by a concerned member of the public who examined ONS mortality data over the past 4 years. The author raises some simple but crucial questions.
It is not necessary to have a degree in statistics to understand that something is very amiss with public data reporting, with lack of transparency being the most egregious issue. The taxpayer funds the very existence of the ONS. We should have access to the information that we are paying to be collected. This paternalistic idea that we must be ‘protected’ from things we can’t handle is clearly an inversion. It is very obvious that we are not the ones being protected from the obfuscation of facts that would be of great benefit to the public to be aware of, regardless of how dangerous it is to The Narrative™.
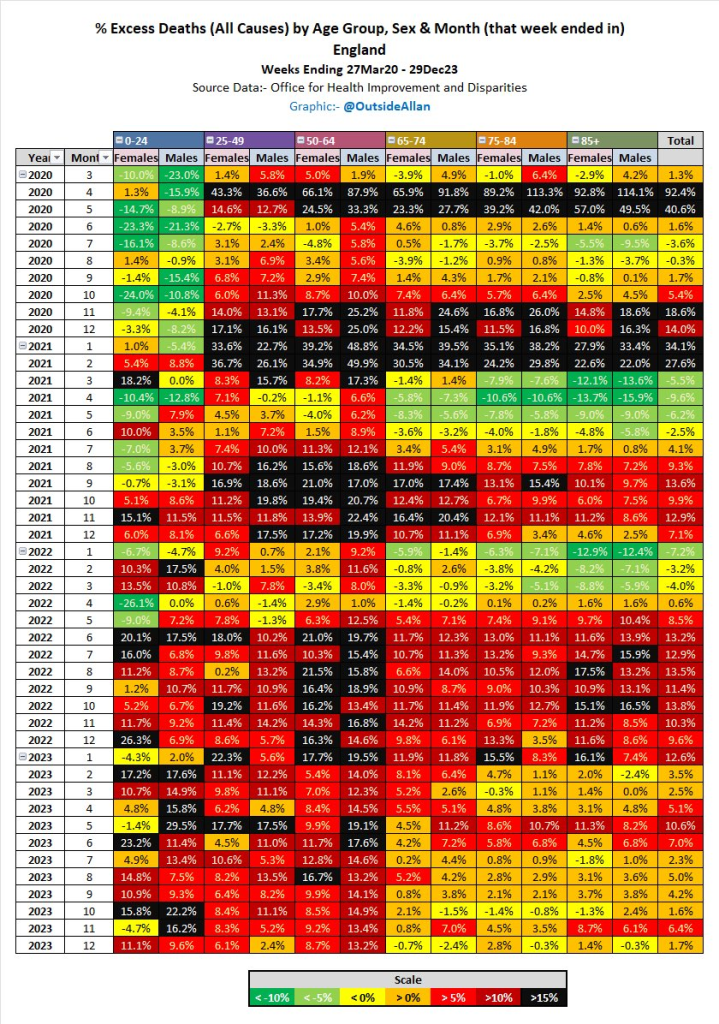
Above is a table of all-cause mortality data from the UK Office of National Statistics (ONS). The figures are broken down by age and sex.
It is easy to forget that these figures represent life-changing tragedies for many thousands of families. This is an invitation to think carefully about what has happened, with a view to getting closer to the truth, not least for the sake of those most affected.
Spring 2020
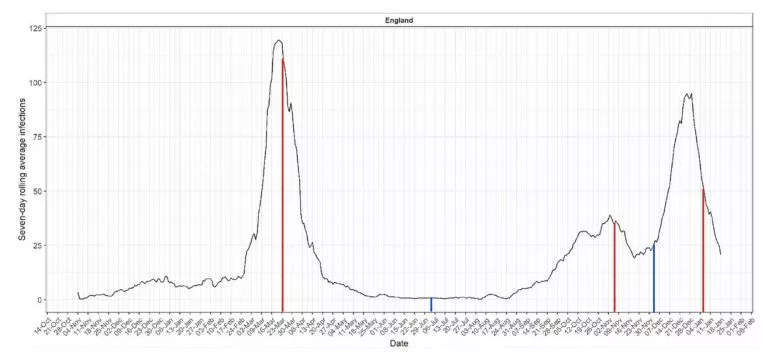
According to media reports, the virus that causes covid was circulating in January 2020. If the virus were as infectious and deadly as we have been led to believe, why were people dying at close to the normal rate in March, but at an exceptionally high rate in April? One change was there was a surge in covid infections. Even if PCR testing is disregarded, when people who developed antibodies were asked when they had their symptoms there was a clear surge from late February 2020, peaking before lockdown. However, not all covid deaths were inevitable and government policy will have led to excess deaths arising from inappropriate covid protocols as well as from non-covid causes too.
Summer 2021
After several months of deaths around or below normal levels, things changed markedly in the second half of the summer of 2021 across all ages and particularly the under 65s? Why might that have been?
Summer and Autumn 2022
After several months of deaths in the over 65s at levels around or below normal during the winter respiratory virus season of Jan-Mar 2022, substantially more people in this group died in the summer and autumn of 2022, i.e. outside respiratory virus season. Something somewhat similar happened with the under 65s. How might this be explained? And how did the media coverage in 2022 compare with that in summer 2020 when there were substantially fewer excess deaths in all age groups?
2023
Normally after a period where more people die than usual, there is a period where fewer people die than usual. But despite the excess deaths in the second half of 2022, 2023 has seen further excess deaths in almost all age groups in almost every month, and particularly so in the under 65s. And according to government data, this has been disproportionately affecting higher income groups. What might have been causing this?
The sound of silence
More generally, why has there been so little serious discussion of excess deaths during the last two years? Why are government ministers and journalists and medics and church leaders so slow to speak out about this? Where are the likes of Whitty and Vallance? Where are the government press conferences? Where is the Opposition?
Covid vaccine status
As I understand it, the ONS also possesses this data broken down by covid vaccine status, and they have supplied it in that form (presumably anonymised) to pharmaceutical companies. Why is such data not being released to the public who paid the taxes to fund its collection? If we really have had a “safe and effective vaccine”, this would be a straightforward way to demonstrate it from real-world data (as distinct from dubious modelling).
Finally, based on the above, to what extent do you think we have been told the truth over the past four years?
