Death rates were elevated not just case rates
Also available on Substack – Come and join the conversation with open comments
In 2021, HART raised the alarm about an increased risk of covid infection in the first two weeks after vaccination from multiple sources. This was likely due to the immunosuppressive effect of the shots in the weeks directly receiving the shot. The result was that susceptible individuals actually became ill with the circulating variant within two weeks of vaccination. This resulted in a lower infection numbers in the period thereafter, creating an illusion of efficacy. In fact, all that had happened was a ‘speeding up’ of the natural spread, skewing the data curve. In addition, these earlier cases would have been labelled as ‘unvaccinated’ in any dataset, as illness occurred before the vaccines were deemed to be ‘working’ (an arbitrary 15 days post-vaccination).
Background
When a person is injected with these novel treatments, millions or even billions of cells potentially throughout their body are turned into spike factories. The immune system will typically detect and destroy these cells as they start to express the foreign spike peptide and thus appear to be infected. It is through this mechanism that the immune system is thought to be educated such that it recognises the covid spike in future. While the white blood cells (e.g. lymphocytes and neutrophils) are busy handling the onslaught of foreign spike production, they are unable to do their day job and the levels of lymphocytes circulating after the Pfizer injection plummeted as did the levels of neutrophils after AstraZeneca vaccination.
The impact of this on how the body can handle a virus is evident from the higher rates of infection with other viruses in this period including shingles, Cytomegalovirus, Herpes Simplex virus and Epstein Barr virus. The fact that viral infections occur at a higher rate is evidence that the low white blood cells have a real world impact.
The period of immune suppression may cause a range of issues. The correlation seen between vaccination and covid waves may be more than just a coincidence. The reactivation of dormant viruses may explain some adverse events and the extensive cell death as the immune system clears the affected cells may explain others. Focusing on covid in particular, does this period of immune suppression cause more than just an increase in covid cases? What happens to people who catch covid while their immune systems are otherwise occupied?
Alberta’s data
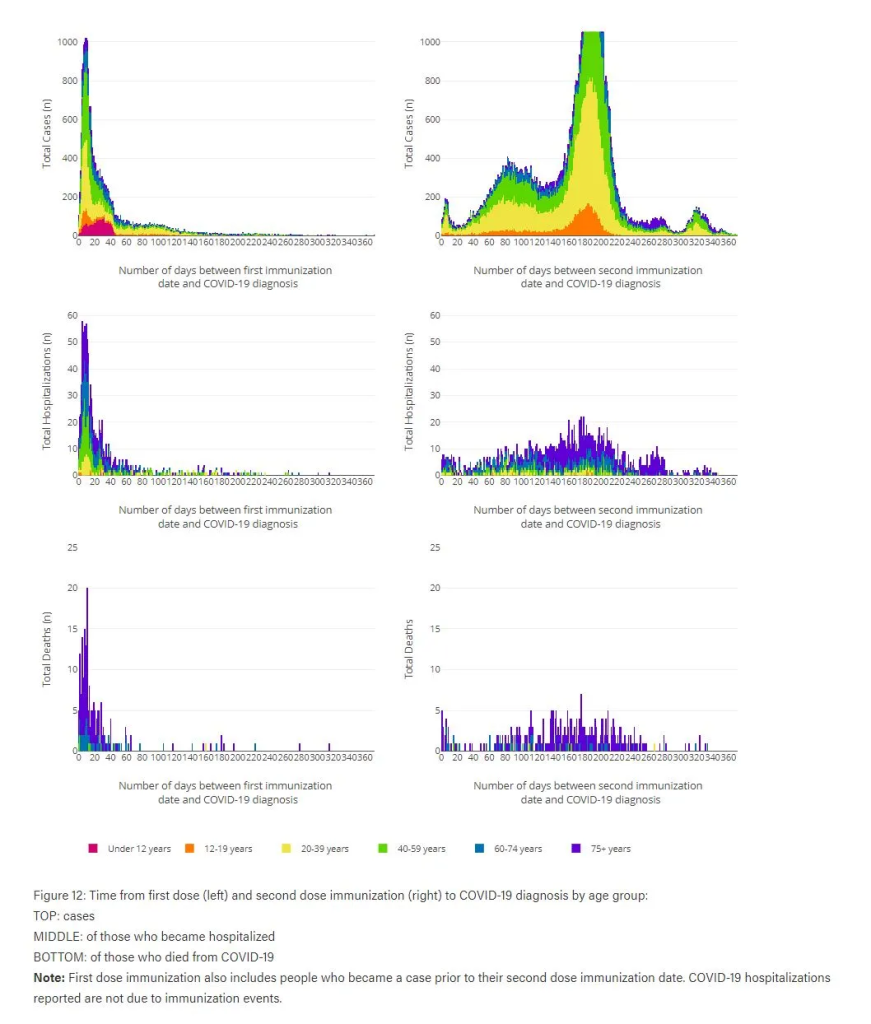
Data from Alberta Canada sheds a light on this. The data was published at the end of the Delta wave and gave figures for cases, hospitalisations and deaths by age group. It was since deleted but Joel Smalley kept a copy. The data is presented in terms of the time from first dose so there is no calendar time to allow comparison with what was happening in the whole population. However, there is a way to compare.
Risk in the unvaccinated
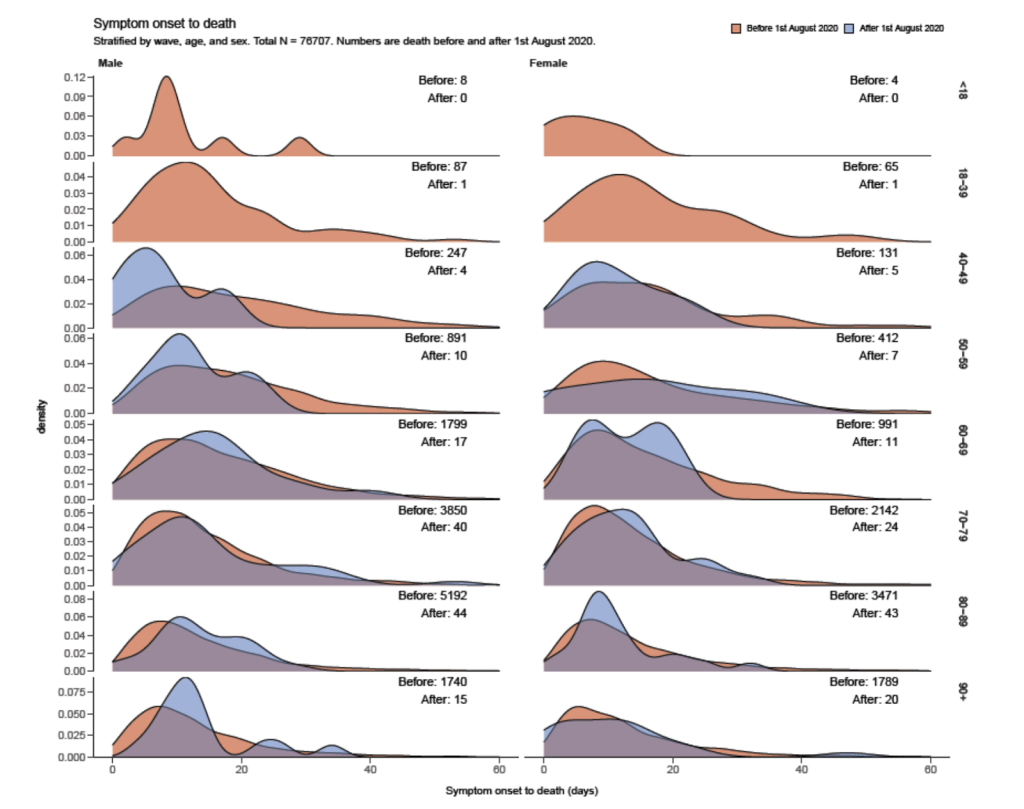
Before we go any further, let’s stop and think about what ought to happen in the first two weeks after vaccination. People who are sick with covid would defer the injection. However, a small number of people could be in the presymptomatic period and develop symptoms coincidentally after injection. If we assume the same course of disease as for the pre-vaccination period, then for 60-75 year olds we would expect a median of between a week and two weeks before dying. Therefore, upon vaccination there ought to be a period of a few days to develop symptoms and then deaths would peak a week later.
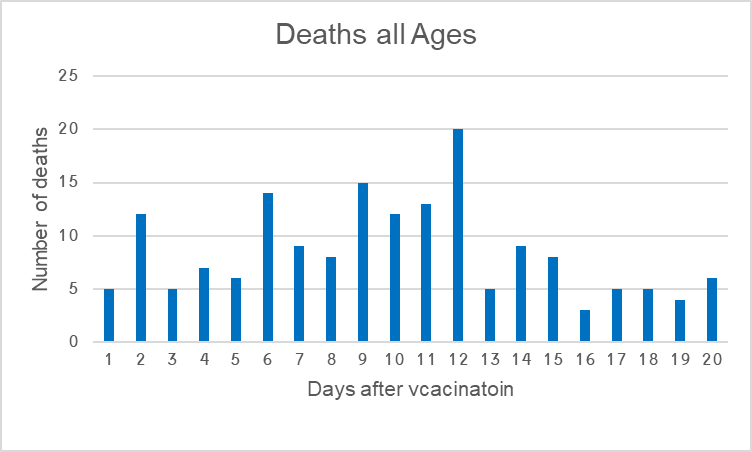
Deaths began on the day of vaccination and rose thereafter peaking on day 12 (see figure 3). The daily deaths for the whole Albertan population in the 14 days after injection reached 20 per day. In total there were 58 deaths in the first week after vaccination and 82 in the second week. When compared to the weekly rates for the population as a whole (table 1) these deaths are at a much higher rate than would be expected.
| Monthly deaths in whole population Alberta | Deaths per week | Daily deaths | Percentage of whole population vaccinated mid-month | Age group vaccinated | |
| Dec 2020 | 518 | 117 | 16.7 | 0% | |
| Jan 2021 | 547 | 124 | 17.6 | 2% | Over 75s |
| Feb 2021 | 250 | 63 | 8.9 | 2% | Over 75s |
| Mar 2021 | 106 | 24 | 3.4 | 8% | Under 75s from 15th |
| Apr 2021 | 91 | 21 | 3.0 | 20% | Under 75s |
| May 2021 | 142 | 32 | 4.6 | 44% | Under 75s |
| Jun 2021 | 80 | 19 | 2.7 | 62% | Under 75s |
Deaths in Alberta
In Canada as a whole, 92% of covid deaths have been in the over 60 year old age group, so it is reasonable to focus on them when looking at covid mortality. By 15th March 2021, vaccination moved from the over 75 year olds to younger age groups. Analysis of the over 75 year old age group is hard because there is no data on the proportion vaccinated over time and the background deaths changed massively during their vaccine rollout. However, it is possible to analyse the 60-75 year old population. They were vaccinated during a period of very steady cases and deaths in the population as a whole.
If we want to study the period immediately after vaccination then we should compare it to the wider population over the same period. By 10th June, the vaccination rate among over 60 year olds ranged from 65% (in a few rural areas) to 90% in the cities. Clearly the real figure will be nearer to 90% as over 80% of Albertans live in the cities. Even if we make the generous assumption that 90% ended up vaccinated, then when averaged over the whole period, the majority were unvaccinated.
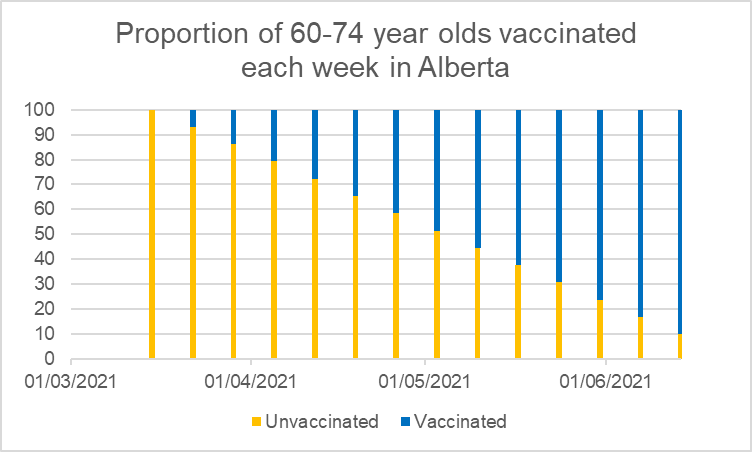
Focusing on 60-74 year olds
There were a total of 315 deaths in Alberta from 15th March to 10th June 2021. If we assume the same age distribution as for deaths across all of Canada there would have been 38 deaths of people in their 50s, 69 in their 60s, 90 in their 70s and 118 over 80 year olds. For people aged 60-75 years that would work out at about 9 deaths a week over the 87 day period (114 altogether).
You might assume that most of those deaths would be among the unvaccinated, especially as no-one was vaccinated at the beginning of the period and fewer than 90% by the end. However, there were 35 deaths, or 30% of the total, among people who were within 14 days of the vaccination.
Even if we assume that there were no deaths in the vaccinated after 14 days (there were e.g. 13 deaths in weeks 3-4 after injection), then the deaths in the unvaccinated would amount to 79 in total (114-35=79). This works out at 12 deaths per fortnight for 60-74 yr olds. Far lower than the 35 deaths in the fortnight after vaccination.
Conclusion: The mortality rate in the two weeks after vaccination is at least three times higher than the background mortality rate.
Risk of severe illness or death
The Alberta data also allows a calculation of the case fatality rate, the hospitalisations per case and the deaths per hospitalisation in the first 14 days after vaccination. However, the comparison data for Canada uses different age brackets which makes a direct comparison harder.
| Case fatality rate | 50 to 59 | 60 to 69 | 70+ | 70 to 79 | 80+ |
| ALL OF CANADA Aug-Dec 2020 | 0.3 | 1.4 | 10.6 | 5.5 | 14.9 |
| 40-59 | 60-74 | 75+ | |||
| ALBERTA within 14 days of vaccination | 0.2 | 3.2 | 17.6 | ||
| ALBERTA more than 14 days of vaccination | 0.3 | 1.4 | 10.3 |
Comparing rates for the younger age group is hard because the numbers are small and the difference in age groupings means there is no exact number to compare it to. They have been included for completeness.
The case fatality rates were substantially higher in the over 75 year old population in the 14 days after vaccination, higher even than the unvaccinated rates in over 80 year olds. After the first 14 days it returns to levels similar to the unvaccinated rates for the over 70s as a whole.
| Hospitalisations per case | 50 to 59 | 60 to 69 | 70+ | 70 to 79 | 80+ |
| ALL OF CANADA Aug-Dec 2020 | 4.3 | 9.6 | 24 | 21.8 | 26.6 |
| 40-59 | 60-74 | 75+ | |||
| ALBERTA within 14 days of vaccination | 5.1 | 15.7 | 26.2 | ||
| ALBERTA more than 14 days of vaccination | 3.9 | 7.8 | 28.2 |
The hospitalisation rate for over 75 year olds after vaccination was higher than the rate in the over 80s pre-vaccination and remained high.
| Deaths per hospitalisation | 50 to 59 | 60 to 69 | 70+ | 70 to 79 | 80+ |
| ALL OF CANADA Aug-Dec 2020 | 7.3 | 14.6 | 44 | 25.1 | 56.0 |
| 40-59 | 60-74 | 75+ | |||
| ALBERTA within 14 days of vaccination | 3.2 | 20.1 | 67.1 | ||
| ALBERTA more than 14 days of vaccination | 6.6 | 17.6 | 36.7 |
The deaths per hospitalisation in the over 75 year olds rose to substantially higher than the over 80s rate in the pre-vaccinated for the first 14 days after vaccination.
At least in the oldest group, the case fatality rate and hospitalisation rate and hospital fatality rate all rose substantially in the 14 day period after vaccination.
It is shameful that when HART were calling out a problem of increased cases during this period, instead of a thorough investigation, the data was hidden. Alberta also hid this data soon after it was published. Hiding the data will have meant many more people would have been exposed to harm than if there had been transparency and open debate.
Conclusion
The Alberta data shows that at a minimum, the death rate in the period within two weeks of vaccination was three times as high as the death rate among the unvaccinated and other evidence also points to a higher risk from covid during the 14 day period after vaccination. The problem of immune suppression in the first two weeks was not simply one of increased risk of infection. The consequences of those infections were clearly more severe.

