

Bias and why observational studies can’t answer the lives saved question
Dr David White
Part 2, identifying and correcting bias
The first part of this review covered how:
- a reduction in non-Covid deaths in vaccinated individuals, in the observational data used to establish the Inquiry’s estimate of lives saved by vaccination, provides empirical evidence of bias in the data;
- such confounding has been seen in both influenza and Covid vaccine studies;
- the proposed mechanism for a substantial part of this confounding is frailty-related healthy vaccinee effect (HVE) bias.
- pandemic conditions likely added to the confounding.
Why vaccine effectiveness (VE) is the main driver of the 475,000 lives saved calculation
The Covid Inquiry’s estimate of 475,000 lives saved by vaccination is taken from a 2024 Lancet Respiratory Medicine modelling paper by Meslé et al. The complexity of Meslé’s modelling equation, shown below, largely reflects fine-tuning of the estimate to adjust VE for dose, time since vaccination, the delay before protection and waning.

Figure 1. Lives saved modelling equation from Meslé et al. Screenshot from the paper and too wide to fit on one line.
At its core, two quantities do most of the work: the number of observed Covid-19 deaths and the assumed proportion of Covid deaths prevented by vaccination VE x PV (vaccine effectiveness x proportion vaccinated, or the population prevented fraction).
The genealogy of the equation can be traced back using Meslé’s references from the 5 dose version, to a 2 dose Covid vaccine version, and a 1 dose influenza vaccine version which is much simplified.
The principle of how the equation works can be illustrated using a similar simplified version (figure 2) using the mathematical structure inherited from the earlier one-dose formulation, and values from the Meslé et al. paper aggregated across doses.
Meslé et al. report 185,327 Covid-19 deaths in England and Scotland between week 50 of 2020 and week 12 of 2023. (Our World in Data reports 143,511 Covid deaths in the U.K. over a similar period, 7 December 2020 – 20 March 2023. Variation in definition of a Covid death compared with The European Surveillance System (TESSy) may account for much of the difference.) VE inputs were substantially derived from observational studies. Two of the studies included by Meslé et al. can be used as examples, taking Covid mortality VE estimates of approximately 88% from Hulme et al. for the first booster, and 86% from Kaura et al. for the first dose, giving a simple mean VE of 87%. If this is combined with an approximate vaccination coverage (PV) of 83%—the average proportion vaccinated for the first four doses shown among those aged 80 years and over—the implied proportion of deaths prevented is VE x PV that is 0.87×0.83=0.72. If 72% of Covid deaths were prevented by vaccination, then 28% or 1-(VExPV) = 0.28 of Covid deaths were not prevented and these are the 185,327 Covid deaths that were observed. As the 185,327 deaths observed represent the 28% of lives that were not saved, calculating the estimated population size for the other 72% that were saved is straightforward.
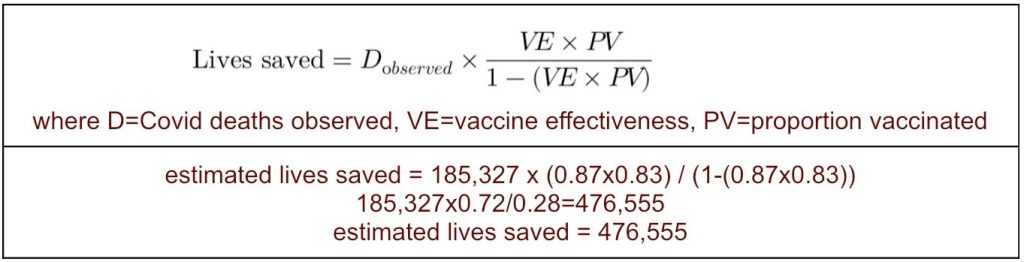
Figure 2. simplified illustration of the underlying mathematical relationship. VE and PV here represent population-average values across the vaccinated cohort as a whole, not values for a single dose category
This simplified calculation produces an estimate of 476,555, remarkably close to the 474,627 lives saved produced by the full Meslé model for England and Scotland.
Figure 2 is not a literal restatement of Meslé et al.’s equation, it omits the paper’s dose and time-stratification, but it isolates the two quantities doing most of the work: the number of observed Covid-19 deaths, and the assumed proportion of deaths prevented by vaccination VE x PV. Once the number of observed deaths and the assumed VE and vaccination coverage are specified, the estimated number of lives saved follows largely from those assumptions.
If the assumed VE is substantially inflated by bias in the observational studies from which it was derived, the estimated number of lives saved is also inflated by bias.
Identifying and correcting bias in observational studies using non-Covid-19 deaths as a negative control outcome.
The FDA has stated it will report in 2027 on methods of using controls to adjust for unmeasured confounding in vaccine studies.
In anticipation of the 2027 report, this review looks at how residual bias can be corrected using current methods, and applies them to two observational studies underpinning estimates of VE in the Lancet modelling paper. Firstly formalising the presence of significant bias, secondly using a control to quantitatively correct for bias, and thirdly looking at some of the limitations of such a method.
The principle that non-Covid or non-target deaths could act as a control group has been repeatedly suggested:
1. The ONS has proposed: ‘we can use non-COVID-19 mortality as a control outcome to assess the amount of confounding left in our model’
2. Lipsitch et al. discussed the principles of negative controls in 2010.
In a randomised trial, the effect of bias such as the HVE is minimised by the process of randomisation. This isolates any vaccine effect from the effect of bias as far as is possible. In an observational study vaccination status is chosen by individuals, so selection bias is not excluded by randomisation. Here any observed apparent reduction in Covid-19 deaths is a combination of real vaccine effect and bias. A suitable control would be an outcome or cause of death that measured only the bias. That is an outcome that vaccination could not plausibly prevent, but was susceptible to the same type and same amount of bias in the same direction, meaning any apparent effect measured in this group would be due to bias only.
3. Levintow et al. noted the increasing use of non-randomized designs for regulatory decision-making and the need to control for bias in these studies and introduced the term negative control outcome (NCO) and said: ‘An NCO is assumed to have no causal relationship with a treatment under study while subject to the same confounding structure as the treatment and outcome of interest’.
4. A Danish study by Obel et al. looked at several NCOs in 2024 and found: ‘The risk of death after SARS-CoV-2 infection was lower in the vaccinated cohort, as was the risk of death after acute myocardial infarction, stroke, cancer, low energy fracture, and head-trauma.’… indicating … ‘the presence of substantial confounding in observational studies of SARS-CoV-2 vaccine effectiveness.’
Two input studies into the Lancet modelling paper reported on the NCO ‘non-Covid death’.
- In both the apparent VE against non-Covid-19 death was almost as large as the apparent VE against Covid-19 death. For Hulme et al. 80.3% v 88.5%, and for Kaura et al. 82% v 86%.
How could bias be formally identified?
One method suggested for formalising whether observational data is still confounded after adjustment, is by testing the negative control association with vaccination against the null hypothesis of no association. Most studies in Zafari et al.’s review identified the likely presence of bias by rejecting a null hypothesis if the association was statistically significant.
The approach can be applied to Hulme et al. data (figure 3) to test the association between booster vaccination and the NCO of non-Covid mortality. Using unadjusted figures from the main analysis, days 29-70, the association was highly statistically significant (χ² = 3062.3, df = 1, p < 0.000001) indicating that the null hypothesis of no association can be rejected and providing strong evidence of residual bias in the observational data. Regarding the adjusted data, since the paper states ‘booster vaccine effectiveness (VE) was calculated as 1-HR’ the same formula VE=1-HR can be used to back calculate the aHRs (adjusted hazard ratios) and confidence intervals (CIs). The stated VE = 80.3% (95% CI=79.0–81.5) against non-Covid death becomes aHR = 0.197 (95% CI = 0.185 to 0.210). The HR is well below 1 and CIs exclude the null value of 1 by a large margin.
What was a suggestion, can now be considered a highly statistically significant association between booster vaccination and reduced non-Covid mortality, using both the raw and adjusted data, assuming the negative-control assumptions hold. This in turn suggests this observational data cannot provide a reliable estimate of lives saved because residual confounding cannot be shown to have been adequately controlled.
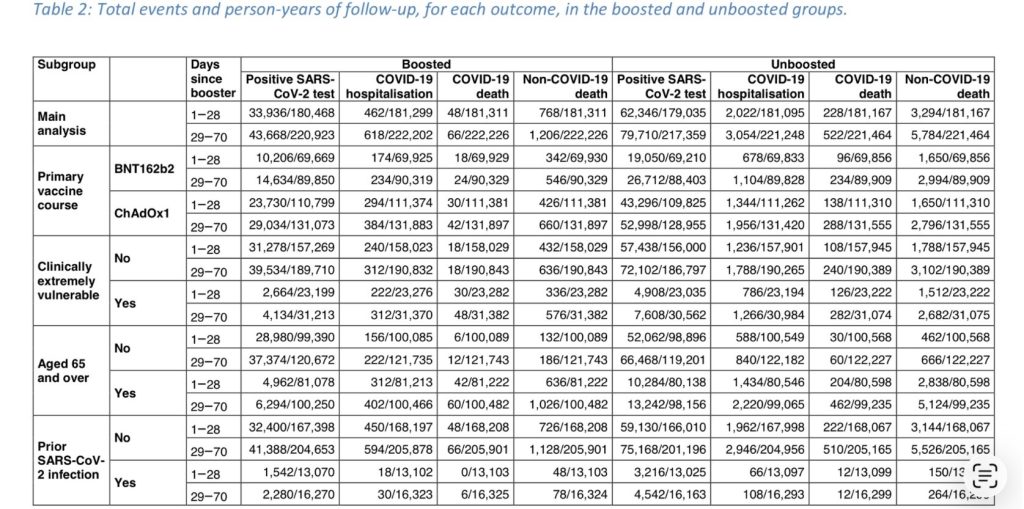
Figure 3. Table of results from Hulme et al.
If the data from Hulme et al. suggests an apparent VE of 80.3% can be due to confounding and that from Kaura et al. suggests 82%, how much benefit is left after removing the confounding, and how can the confounding be removed?
How could the bias be corrected mathematically?
Although the ONS has used non-Covid-19 deaths to identify bias, in the 2023 paper it did not take the next step of using that assessment to adjust the observed VE to remove residual bias. Possibly because the method of optimal quantitative correction remains an active area of methodological research. The US Food and Drug Administration (FDA) has said it would initiate a methods development project by September 2024 to develop a double negative control adjustment to reduce unmeasured confounding in studying effectiveness of vaccines, with a report due in 2027. The 2025 protocol states the study vaccine to be Shingrix, and the study is designed ‘to reduce unmeasured confounding due to health seeking behavior’.
In essence the residual bias needs to be removed from the observed VE, incidence rate ratio (IRR), risk ratio or hazard ratio by using information from the negative control outcome measure.
Although VE = 1−IRR, because residual bias acts multiplicatively on IRR (not additively on VE), the bias cannot be removed by simply subtracting one VE% from another. From figure 4 it is also clear that the adjustment can’t be made by subtracting the rate of death per 100,000 PY due to a non-Covid death, from rate of death due to a Covid death, non-Covid deaths were more than 10 times more common. To make a valid comparison ratios are used, in this case incidence rate ratios (IRR), also known as rate ratios, as shown in figure 4. Incidence rate ratio is the rate of death in the boosted dividend by the rate in the not-boosted. This is convenient as vaccine effectiveness is conventionally expressed as one minus some measure of relative risk: VE=1-RR when a risk ratio is used, VE=1- IRR when an incidence rate ratio is used, and VE=1-HR when a hazard ratio is estimated.
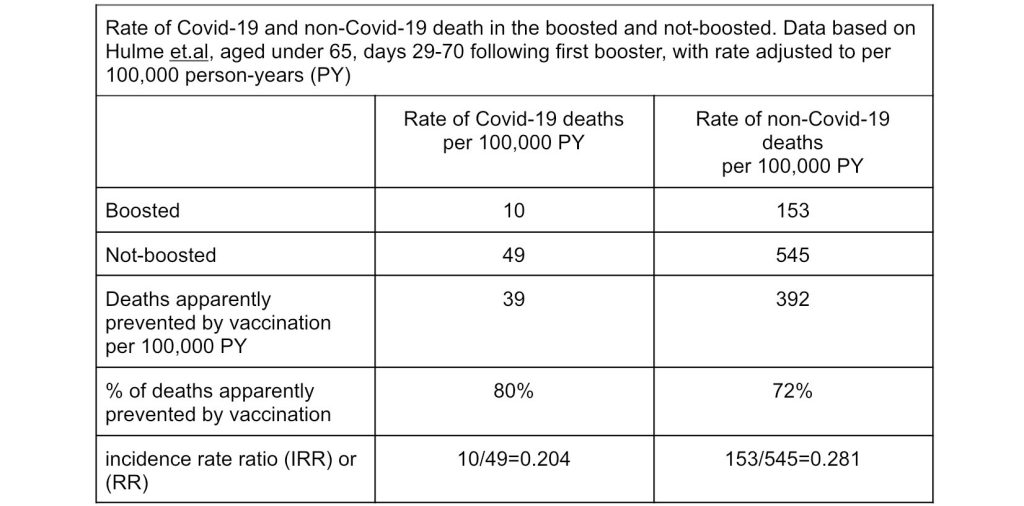
Figure 4. Comparing Covid and non-Covid deaths in the boosted and not-boosted
Some studies using bias correction techniques have been published. In 2023 an FDA public virtual workshop reviewed both identification and correction of bias using negative controls. Page 60 of the slide deck appeared to be referencing Zafari et al. when stating – the subtraction/division method was classed as a major approach for correction, and the method used in 6 of the 16 studies identified as using negative controls to obtain bias-adjusted estimates.
The FDA slide deck states that for correction using ratios, the division method is used and shows an example equation based on a description from Leonard et al. (figure 5)
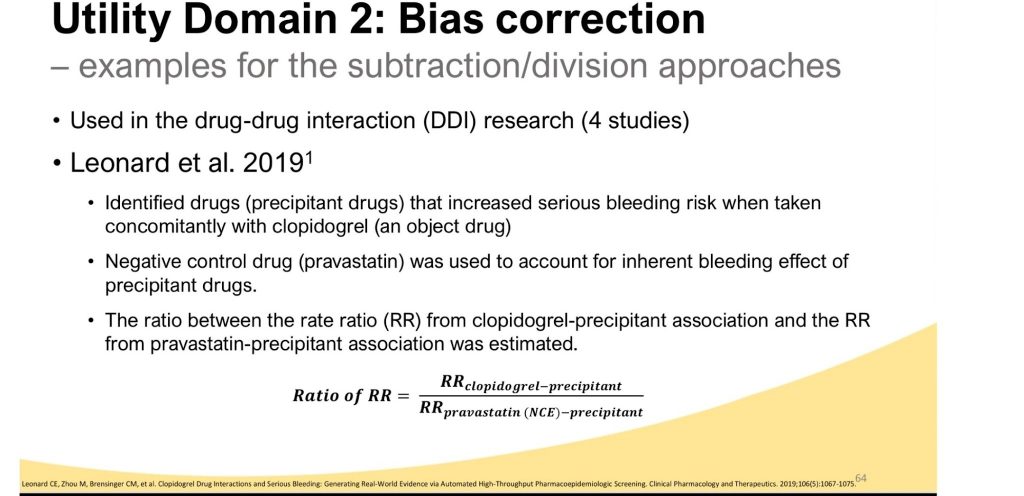
Figure 5. Slide by Zafari and Park from slide deck for FDA virtual workshop
Turning this example equation which uses rate ratios (here abbreviated as RR), into a general equation it becomes –
- Corrected RR = Ratio of RRs = Observed RR of interest / RR NCO
- corrected rate ratio = rate ratio observed / rate ratio negative control
Under the assumption that the negative control outcome is unaffected by vaccination and is subject to the same multiplicative confounding as the outcome of interest, the division method estimates a bias-adjusted rate ratio by dividing the observed outcome incidence rate ratio by the negative control incidence rate ratio.
My understanding of the algebra and assumptions underpinning this equation is shown in figure 6.
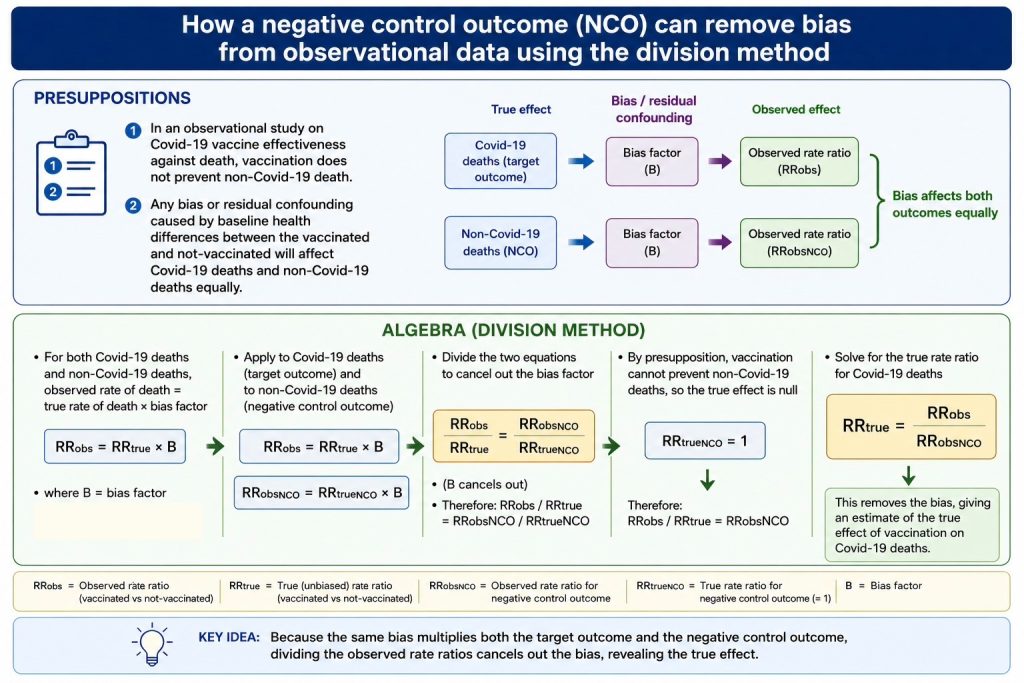
Figure 6. How a negative control outcome can remove bias from observational data to produce a bias-adjusted estimate.
Division method correction applied to Hulme et al
VE as stated in the paper’s abstract. This VE was calculated from adjusted hazard ratios.
Original VE against Covid-19 death in observational study 88.5%
Step 1 — Convert VE back to hazard ratio (HR = 1 − VE)
Covid-19 death: HR = 1 − 0.885 = 0.115
Non-Covid-19 death: HR = 1 − 0.803 = 0.197
Step 2 — Divide out the non-Covid HR from the Covid HR
Corrected HR = HR(Covid death) ÷ HR(non-Covid death) = 0.115 ÷ 0.197 = 0.584
Step 3 — Convert back to VE
Corrected VE = 1 − 0.584 = 0.416, i.e. ≈41.6%
Division correction applied to Kaura et al. data.
Original VE against Covid-19 death in observational study 86%
Corrected IRR = IRR(Covid death) ÷ IRR(non-Covid death)
Pfizer-BioNTech: 0.14 ÷ 0.18 = 0.778 → corrected VE = 22.2%
For Hulme et al. the adjusted VE against Covid-19 death as stated in the abstract was 88.5%. After removal of residual bias using the NCO ‘non-Covid-19 death’ the corrected VE was 41.6%. For Kaura et al. the original VE against Covid-19 death for Pfizer-BioNTech was 86% and the corrected or bias-adjusted estimate of VE was 22.2%.
Hulme et al. break down the unadjusted population data (figure 3 and figure 7). This is not only more informative but provides a test of plausibility and consistency of the division method for correcting residual bias in observational studies.
Hulme’s day 1-28 VE of 79% suggests very early onset of action. The NCO corrected VE was 10% which perhaps aligns better with biological expectation. The days 29-70 corrected VEs show good consistency for those aged under 65, aged 65 and older, and those with no prior SARS-CoV-2 infection, with corrected VEs between 28% and 37%. The larger correction factor for days 1-28 than 29-70 is consistent with a stronger frailty-related HVE in the month immediately after vaccination. For the extremely clinically vulnerable the day 29-70 corrected VE was lower at 21%. A lower figure would be expected for those with weakened immune systems.
Hulme’s only outlier is the 29-70 day corrected VE of -70% for those with a prior history of SARS-CoV-2 infection. This negative VE is a worrying finding needing further investigation, but must be interpreted with caution as it is based on small numbers, with 6 boosted Covid-19 deaths and 12 unboosted. Only 3 fewer Covid-19 deaths in the boosted would bring corrected VE back to +17%.
The paper’s adjusted VEs are higher than those calculated using the raw data for both Covid and non-Covid deaths. This pattern raises the possibility that not only did adjustment for potential confounders not adequately control for the healthy vaccinee effect, but that it may even have added an amplification bias. Jackson et al. have stated the HVE cannot be adjusted for using comorbidities, as the main influence (suggested by Simonsen et al.) is frailty.
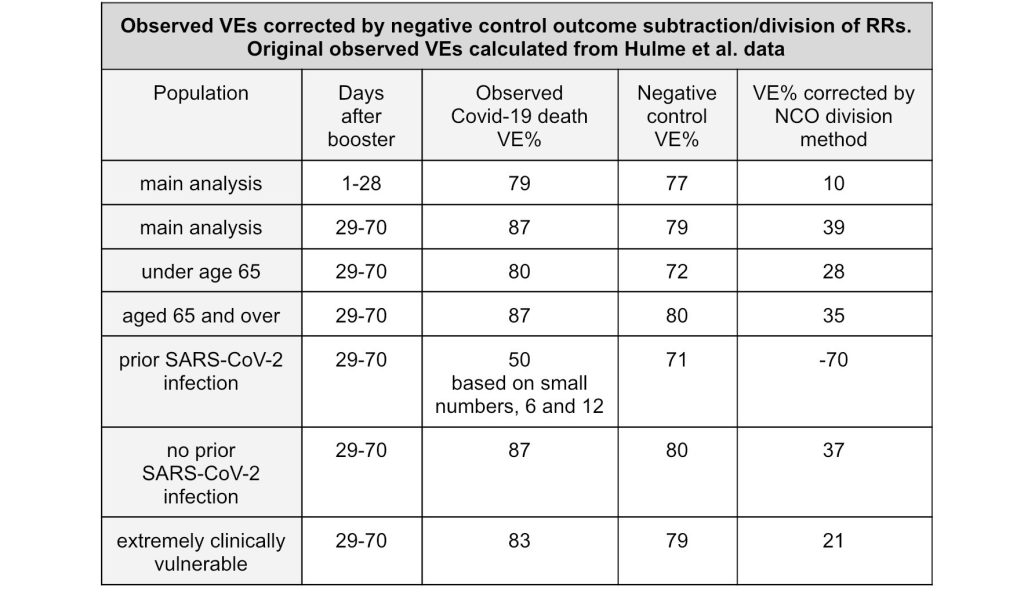
Figure 7. Original data is from Hulme et al. but shown corrected for residual confounding using the NCO of non-Covid-19 death. Original VEs have been calculated from the results table data (figure 3)
OpenSAFELY collaboration: Horne, Hulme et al.(2024) follow up paper
The Hulme et al. 2022 paper, which contributed to the Inquiry’s estimate, is from the OpenSAFELY collaboration, which also published a follow up 2024 paper – an observational matched cohort study, on a larger population also receiving the first booster. Importantly this study stated that it included negative control outcomes to indicate unmeasured confounding, and mentions the possibility of misattribution of cause of death affecting data.
They included the following negative control outcomes: non-Covid-19 death, cardiovascular disease death, cancer death and fracture, and stated:
‘The rationale was that differences between vaccine groups in these additional outcomes could indicate unmeasured confounding so that they serve as “negative control” outcomes. In addition, between-group differences in non-COVID-19 deaths could also indicate misattribution of the cause of death or real effects of vaccination.’
After noting reductions in non-Covid, cardiovascular and cancer deaths in the vaccinated, they stated:
‘These results suggest unmeasured confounding, plausibly because individuals with advanced cancer are less likely to receive a booster dose than individuals without. This reasoning extends to other non-COVID-19 deaths, as individuals at high risk of death in the next 6 months may be less likely to receive a booster dose.’
The paper did not attempt any correction of VE using the NCOs, but in the conclusion stated: ‘Observational studies should report estimated vaccine effectiveness against nontarget and negative control outcomes’. Hopefully in their future publications, the OpenSAFELY collaboration will take the next step and use the NCO data to correct their observational data for unmeasured residual confounding.
Applying the NCO corrected VEs to the lives saved estimate.
Using the mean of the stated VEs shown in the abstracts of 2 of the papers used by Meslé et al. and applying it to the simplified modelling equation in figure 2 gave an estimate of lives saved of about 476,500. The NCO corrected mortality VE for Kaura et al.data was 22.2%. For Hulme et al. for those aged 65 and over using unadjusted data, NCO corrected VE was 35%. Applying an unweighted average of these (28.6%) to the simplified equation while keeping observed deaths and proportion vaccinated unchanged, demonstrates how sensitive the calculation is to VE.
estimate of lives saved = 185,327x((0.286×0.83)/(1-(0.286×0.83)))=57,687
Thus, replacing the original VE assumption (about 87%) with an illustrative NCO-corrected VE of 28.6% reduces the estimated number of lives saved from approximately 476,500 to about 57,687. This is not proposed as a revised estimate of lives saved. It is a sensitivity illustration showing how strongly the modelled result depends on the assumed VE.
Although the NCO correction of VE against death from about 87% to about 28.6% has suggested a reduction in the number of the lives saved estimate to about 57,687, this is still likely to be an overestimate because at least 2 further sources of bias, which are not correctable by the NCO, and therefore still remain in the estimate, need to be considered. These are vaccinating during an outbreak and misattribution of cause of death.
Bias may have compromised the negative control outcome itself. Measuring two self-fulfilling prophecies?
There was no choice in the NCO selection of ‘non-Covid-19 death’ and the consequences of using this as an NCO need to be considered. There were at least 2 possible mechanisms that could have caused violation of the NCO which would result in an over optimistic corrected-VE. Neither of these additional biases specific to the Covid vaccine rollout can be corrected using the NCO ‘non-Covid-19 death’. This is because these biases (unlike frailty-related bias) do not influence both Covid and non-Covid deaths by the same amount and in the same direction.
Differential misclassification of cause of death.
Up to this point we have been considering bias at the level of who gets vaccinated and who does not. Here we need to consider bias at the level of whose death is attributed to Covid-19 and whose death is not. Death had to be either from Covid-19, or not from Covid-19. If misclassification occurred, and it occurred symmetrically in the vaccinated and unvaccinated it would not be of concern in this analysis. But if the misclassification was differential, that is more likely in the unvaccinated, then the NCO has been violated. This would add an extra layer of bias which cannot be removed by the correction method used above. Classification bias in death certification and PCR testing-related bias could both contribute here.
So was there misclassification and was any misclassification more common in the unvaccinated, or was there misclassification in one direction in the unvaccinated and in the other direction in the vaccinated? It is not difficult to imagine how this could have happened in the context of death certificates, considering for example, the guidance given to doctors and the media environment.
Scottish Government guidance from the Chief Medical Officer to medical practitioners dated 24.3.2020:
‘There may be cases where … the medical practitioner is short of information as to the deceased’s recent state of health. In these circumstances, the medical practitioner should consider … the fact that there is a COVID-19 Pandemic, that the COVID-19 Pandemic has struck in the locality, whether there was any evidence of medication suitable for treating the symptoms of … COVID-19 …e.g. analgesics, cough medicine, medicines to reduce the fever, etc. … where there are no suspicious circumstances, it would be considered to be clinically responsible to certify the death as “presumed COVID-19 disease”. This will be accepted as a cause of death by the local authority registrar.’
Here is a quote from the Metro dated 13.1.2021 after Dr Sara’s comments on This Morning the previous week:
‘What’s really interesting, and I think it’s a statistic that should be shouted from the rooftop, is that after 12 days from the first vaccination of the AstraZeneca vaccine, you are 100% effective against hospitalisation and death,’ Dr Sara said at the time.’
I have given Dr Sara as an example but similar claims were being made across multiple media by multiple people in positions of authority including a president over a prolonged period of time.
From the perspective of a retired GP, if I had been faced with 2 unexpected deaths to certify after listening to Dr Sara, one vaccinated, the other not-vaccinated, both in possession of paracetamol, what would I have put on the death certificates? In normal circumstances both would have a postmortem. Apparently my vaccinated patient now could not have died from Covid-19 and must have died from an underlying disease, dementia, coronary artery disease, complications of diabetes etc. But my unvaccinated patient, according to the guidance, if I was being ‘clinically responsible’, still, on the balance of probability, died of Covid-19. These circumstances create a plausible mechanism for differential misclassification which would bias any observational study defining a Covid-19 death using Covid-19 on the death certificate. How big was the effect?
We are considering 2 observational studies, one using death certificates to define a Covid-19 death and one using a positive PCR test. Adjustment using the NCO removed considerably more residual confounding from the study using PCR testing. Although it is tempting to base an estimate on this difference, because other variables may also account for the difference and the data are so limited, it is not feasible to estimate the size of the effect here.
Instead, we can use a sensitivity analysis to estimate how much differential misclassification of the NCO would be needed to reduce the NCO corrected VE to 0%, using Hulme et al. data (figure 3) which identified Covid-19 deaths from death certificates.
In adults aged under 65 years (29–70 days after booster), the observed vaccine effectiveness against Covid-19 death was 80%. Adjustment for frailty-related healthy vaccinee bias using non-Covid mortality as a negative control reduced the estimated vaccine effectiveness to 28%. This analysis assumes that the negative control outcome is not itself affected by misclassification of Covid-19 deaths. As a sensitivity analysis, we can consider the effect of violating this assumption. If approximately 16 non-Covid deaths in the not-boosted group (2.4% of 666) had instead been misclassified as Covid-19 deaths in the not-boosted, then reclassifying these deaths back to the non-Covid category (making 682) would reduce the residual-bias-corrected vaccine effectiveness from 28% to 0%. RRR=(12/(60-16))/(186/(666+16))=1 and VE=1-1=0%.
For those aged 65 and over (29–70 days after booster) a misclassification of 2.9% of non-Covid deaths would have the same effect.
In view of the circumstances under which doctors were issuing death certificates, this amount of misclassification cannot be ruled out on the basis of the available evidence. The sensitivity analysis therefore demonstrates that only a small amount of differential misclassification would be required to completely eliminate the residual apparent VE, but it does not establish that this amount of misclassification actually occurred.
Acute target-disease-specific healthy vaccinee bias – when infection status determines both vaccination status and the outcome
Vaccinating during outbreaks may have introduced an additional and potentially more powerful form of healthy vaccinee effect. A January 2021 guidance letter from NHS England stated:
… ‘vaccination should still take place in care homes with outbreaks. Whilst vaccination against COVID may be temporarily deferred in some individuals e.g. acutely unwell or still within four weeks of onset of COVID symptoms, all other staff and care home residents in a care home where an outbreak is occurring must receive prompt COVID vaccination.’
53% of care homes experienced an outbreak in January or February 2021. When vaccinators arrived at a care home experiencing an outbreak, some residents would have been too unwell to receive vaccination. This group would be expected to include residents with active Covid-19 infection who subsequently died from the disease. These individuals could therefore contribute Covid-19 deaths disproportionately to the unvaccinated group in observational data whether death was defined by Covid-19 recorded on a death certificate or by death within 28 days of a positive SARS-CoV-2 test.
This mechanism differs from the conventional healthy vaccinee effect, which arises because frailer individuals are generally less likely to be vaccinated. Here, the exclusion is immediate and disease-specific, channeling people into the unvaccinated group specifically because of an active infection with the exposure of interest, only a short time before death from it. The 2 mechanisms could be thought of as slow HVE and fast HVE.
Importantly this variant of HVE bias cannot be corrected for using non-Covid death as the negative control. Because the ratio-of-RRs (RRR) method assumes the confounding structure biases Covid and non-Covid mortality proportionately, a bias source that acts specifically on Covid-caused mortality — while leaving non-Covid mortality largely unaffected — will not be captured, or will be only partially captured. In other words, this mechanism plausibly biases the numerator of the correction (the Covid IRR) without a matching effect on the denominator (the non-Covid IRR), meaning the RRR-corrected VE estimates presented for Hulme (41.6%) and Kaura (22.2%) may still be optimistic even after the NCO correction has been applied.
In this situation, the approximately 3.3% of all care home residents already destined to die from Covid-19 in an outbreak are automatically placed into the unvaccinated group. These deaths have no, or a much reduced, equivalent in the non-Covid outcome. Therefore this component of bias is largely invisible to, or underestimated by, the negative control.
To illustrate the potential magnitude of bias introduced by vaccinating during an active outbreak, a hypothetical worst-case scenario, or theoretical upper bound can be considered, using outbreak figures from Giddings et al.
In this scenario a vaccinator visits a care home in early 2021 while a Covid-19 outbreak is ongoing. At that time, approximately 12.67% of residents (on average 5 residents per care home outbreak) have already become infected, confirmed by testing, but no Covid-19 deaths have yet occurred. The infected residents are too unwell to receive vaccination, and remain in the not-vaccinated group, while the remaining residents are vaccinated. During Jan-Feb 2021 85.7% of care home residents received a first dose.
No further residents become infected during this outbreak. The vaccinated group, having been selected from residents who were not infected at the time of vaccination, experiences no Covid-19 deaths.
All of the Covid-19 deaths therefore occurred in unvaccinated residents. The 3.3% of residents who died in an average outbreak would be concentrated in this small unvaccinated group of about 14.3%, or slightly more, of residents. This would equate to an apparent but misleading Covid-19 death rate in the not-vaccinated of up to about 23%.
The resulting comparison would be:
- Vaccinated: Covid-19 death rate = 0%
- Unvaccinated: Covid-19 death rate = ≲ 23%
This produces:
IRR = 0 / ≲ 23 = 0
and an apparent vaccine effectiveness of:
VE = 1 − IRR = 100%
despite an assumption of no biological vaccine effect. As long as the vaccinator called after the 5 (on average) residents had already been infected, didn’t vaccinate these 5 while they remained unwell, and called before the last Covid death, the result in that care home would be an apparent VE of 100%. Even if only 1 or 2 of the infections had been diagnosed before the vaccinator called, the bias introduced by vaccinating during an outbreak would still inflate apparent VE to above the level produced by frailty-related HVE.
This example is a theoretical upper-bound illustration and does not estimate the actual magnitude of bias during the vaccination programme. Rather, it demonstrates the potential direction and scale of bias that can occur when vaccination takes place during an active outbreak and vaccination status becomes strongly determined by current infection status.
The same mechanisms could plausibly have recurred during subsequent vaccination campaigns. The first booster programme was rolled out during the Delta wave, and the second booster during the Omicron wave. Each campaign therefore had the potential to generate a fresh cycle of biased data by: frailty-related healthy vaccinee bias; Covid infection specific healthy vaccinee bias; and differential misclassification of cause of death. Only the first of the 3 can be corrected using non-Covid-19 death as a negative control. After correction for frailty-related bias, both of the other two biases have a plausible mechanism and potential effect size to account for all of the remaining apparent benefit.
It is therefore not possible to estimate with any confidence that any lives were saved by vaccination using the observational data underpinning The Lancet Respiratory Medicine’s modelled estimate quoted by the Inquiry.
Conclusion
The mortality data from the randomised trials are so sparse, the observational studies so confounded and the two are so difficult to reconcile, that the most important question still can’t be answered. A sufficiently large randomised trial in care homes could have provided a much more direct and robust assessment of mortality than the observational studies.
The problem is that the regulatory pathway didn’t require the ‘how many lives does vaccination save’ question to be answered. Emergency use authorisation (EUA) was granted on the endpoint – reduction in symptomatic infection, and once there was an EUA granted, the window for running a trial answering the mortality question closed with the excuse that it would be unethical. Ethics committees could argue the principle of ethical equipoise (there has to be genuine uncertainty about benefit) to frustrate any attempts to definitively answer the most important question. Once the EUA was passed, observational studies and occasionally test-negative studies were the go to options.
This means we are left with two unsatisfactory main sources of mortality data: underpowered randomised trials and observational studies susceptible to confounding.
The Pfizer/BioNTech trial included about 44,000 participants and ran for six months during the pandemic but only three deaths from Covid-19 in the randomised part of the trial were reported in this pivotal study. Regulatory documents tell us one was in a vaccinated participant, one in a placebo group participant, and one in a placebo group participant who also had a Moderna vaccine. The trial reported 15 all-cause deaths in the vaccine group and 14 in the placebo group (or 13 if the participant who had a Moderna vaccine is excluded). The data on deaths is sparse, partly because the frail elderly were underrepresented in the trial. In other words, the gold-standard RCT on which authorisation was based, showed more deaths in the vaccine arm than the placebo arm.
On the other hand, we have observational studies. They are at least superficially appealing. They measure real-world data. They can give results almost in real time. They use big data to try to answer important questions. The NHS has a great deal of computerised data, although it was not primarily collected for research purposes, much of it generated by general practice. They are fast and relatively cheap when compared with randomised trials.
But their fundamental limitations cannot be avoided. Although they analyse large quantities of data, no amount of quantity can compensate when important residual confounding remains in the underlying observational data – and it always will.
Confounding by the HVE cannot be adjusted for by counting comorbidities. No comorbidities are necessary, extreme old age is enough. The issue is frailty, a much more difficult concept for big data to quantify at present, and it is not confined to care homes.
Using non-Covid-19 deaths as a negative control outcome to correct for residual confounding suggested, using Kaura et al. data, VE against Covid-19 death may have been as low as 22.2% between days 14-84 after the first dose. Using Hulme et al. data (29-70 days following a booster dose) suggested a corrected or bias-adjusted estimate of VE = 28% for the under 65s, 35% for those aged 65 and over, and 21% for the extremely clinically vulnerable. Applying an average of Kaura et al. (22.2%) and Hulme et al. (35%) NCO-corrected-VEs of 28.6% to the simplified modelling equation (figure 2), shows how sensitive the estimate of lives saved is to the estimated VE, reducing the apparent number of lives saved to about 57,687.
This correction method depends on the NCO being independent of treatment effect while sharing the same confounding structure as treatment and outcome. But exceptional Covid conditions such as vaccinating care home residents during an outbreak in the care home, few postmortems, negative test results being ignored, staff shortages during care home outbreaks, guidance to doctors and media environment, all suggest that differential misclassification and violation of the NCO, leading to under correction, was a possibility.
Sensitivity analysis using Hulme et al. data showed that if as few as 2.4% of non-Covid-19 deaths in the unvaccinated were misclassified as Covid-19 deaths, this could change a placebo vaccine with a true VE of 0%, into one with an apparent VE of 28%. This matches the corrected Hulme et al. VE in the under 65s, purely as a result of bias due to differential misclassification of cause of death.
Vaccinating care home residents during an outbreak in a care home, meant infection status determined both vaccination status and outcome. This is an extreme example of how confounding can be introduced into observational data, and has the potential in certain circumstances to produce an apparent VE against Covid death of up to 100% within a couple of days, while remaining uncorrected or only partially corrected by the NCO method.
The illustrative number of lives saved by vaccination of 57,687 was arrived at by using the NCO ‘non-Covid death’ to remove unmeasured residual confounding from the data, with the removed confounding likely to be substantially due to frailty-related healthy vaccinee effect. This figure is still likely over optimistic and is still confounded by the effects of vaccinating during outbreaks and misattribution of cause of death, as the bias that these two introduce is not corrected by the NCO ‘non-Covid death’. The figure can be further revised if and when methods of measuring the effects of these two biases are developed, but sensitivity analysis suggests either of these biases could potentially account for all of the remaining apparent benefit.
This analysis demonstrates that the observational evidence cited by the Inquiry cannot distinguish a genuine mortality benefit from the effect of residual confounding. Estimation of a precise figure such as 475,000 lives saved using observational data cannot be justified.
The Inquiry does not appear to have adequately considered how bias in observational data may have influenced the quoted modelled estimate, when bias alone may have accounted for all of the apparent benefit. A sufficiently large randomised trial would have provided the most direct and robust way of answering the lives-saved question. Austin Bradford Hill worked on developing the modern randomised controlled trial (RCT) precisely for this reason. In 1948, the first published RCT showed that streptomycin successfully reduced the death rate from pulmonary TB over 6 months from 27% to 7%.
The Inquiry could have said – “We may never know whether the Covid-19 vaccination programme saved any lives or not. This is because the regulators did not require the mortality question to be answered, which resulted in randomised trials not designed to answer the question. There have been observational studies published which suggest apparent benefit but because this type of study is so susceptible to bias, we can have no confidence in their results. In any future pandemic, such randomised trials as necessary should be conducted to answer the question – does the vaccine prevent death.”
Following publication of the module 2 report, the Office for Statistics Regulation (OSR) wrote to the Inquiry stating: ‘we consider that the Inquiry’s Executive Summary of the modelling does not sufficiently communicate the level of uncertainty associated with the analysis’ – a concern that HART has already pointed out to the OSR, should also be applied to the estimate of 475,000 lives saved, based on an assumption of vaccine efficacy of 67%-95%, presented in Module 4.
The estimated lives saved figure is highly consequential and not limited to resting benignly in a dusty report. Three issues are immediately concerning. Firstly that the same problematic observational data were used to support the rollout of vaccines beyond the initial most vulnerable 15 million to the young and healthy; secondly, when considering risk-benefit balance, the data was used to justify acceptance of higher levels of vaccine harm than previously; and thirdly the report risks becoming a template for the same methodological errors in a future pandemic.
References are hyperlinked except the Scottish Care Inspectorate report but include:
UK Covid-19 Inquiry (Chair: Baroness Hallett). Vaccines and therapeutics (Module 4) report. London: UK Covid-19 Inquiry; 2026.
Meslé M et al. Estimated number of lives directly saved by COVID-19 vaccination programmes in the WHO European Region from December, 2020, to March, 2023: a retrospective surveillance study. Lancet Respir Med 2024;12:714–27. doi:10.1016/S2213-2600(24)00179-6
MacRae J, Ciminata G, Geue C, et al. Mortality in long-term care residents: retrospective national cohort study. BMJ Support Palliat Care 2026;16:188–97. doi:10.1136/spcare-2024-005163
Public Health England. COVID-19 vaccine effectiveness report: March 2021. London: PHE; 2021.
Abu-Raddad LJ, Chemaitelly H, Ayoub HH, et al. Assessing the healthy vaccinee effect in COVID-19 vaccine effectiveness studies: a national cohort study in Qatar. eLife 2024;13:e99910. doi:10.7554/eLife.99910
Thomas SJ, Moreira ED Jr, Kitchin N, et al. Safety and efficacy of the BNT162b2 mRNA COVID-19 vaccine through 6 months. N Engl J Med 2021;385:1761–73. doi:10.1056/NEJMoa2110345
US Food and Drug Administration. Pfizer-BioNTech COVID-19 vaccine: biologics license application (BLA) clinical review memorandum. 2021. Footnote table 32
Humpherson E. Presentation of modelling in the Module 2 report of the UK Covid-19 Inquiry [letter]. Office for Statistics Regulation; 19 February 2026
Scottish Care Inspectorate. Covid-19 related deaths in care homes, 2020/21 Care homes for adults and older people in Scotland. A statistical bulletin. Publication date 26 May 2021.