Claims of excess death being due to an ageing population are overstated
In the second half of the year (June to end Nov) there have been considerably more deaths in 2022 than were seen in the same periods of 2020 and 2021 (see table 1). Why have more people been dying?
It is not because of covid. Under 8,000 deaths were certified as due to covid in the second half of 2022 so far with a further 4,000 where it was mentioned on the death certificate. There are clearly other causes that account for the majority of the recent extra deaths.
| Total deaths 1st week of June to 3rd week of November | Deaths above 2015-2019 average | Deaths involving covid | |
| 2015-2019 average | 234,000 | 0 | 0 |
| 2020 | 243,000 | 11,000 | 22,000 |
| 2021 | 257,000 | 23,000 | 15,000 |
| 2022 | 267,000 | 33,000 | 12,000 |
Claims have been made that more deaths should be expected because of our ageing population. However, there are two flaws with this approach.
Firstly, a large number of elderly people have died in the last two years. People can only die once. After a period of extra mortality it is reasonable to expect that there would be a period of less death following it. Furthermore, if the reason was an ageing population it would be reasonable to expect to see higher levels of deaths with causes which are common in old age, like dementia and Parkinson’s disease. We do not. In fact, there have been 6,961 fewer such deaths than expected (by UKHSA) in 2022.
| 2022 (up to 18th Nov) | Cardiovascular and stroke deaths | Cancer Deaths | Respiratory Deaths | Dementia and Parkinson’s deaths |
| UKHSA expected levels | 327,912 | 138,938 | 184,098 | 96,332 |
| Registered deaths | 357,665 | 140,513 | 178,983 | 89,371 |
| Excess deaths | 29,753 | 1,575 | -5,115 | -6,961 |
| Excess as percentage of expected | 9.1% | 1.1% | -2.8% | -7.2% |
Similarly, deaths from cancer have only been 1% above expected levels and overall deaths with a mention of a respiratory cause have been below expected levels. In contrast, there have been nearly 30,000 more deaths from circulatory diseases including heart disease and strokes.
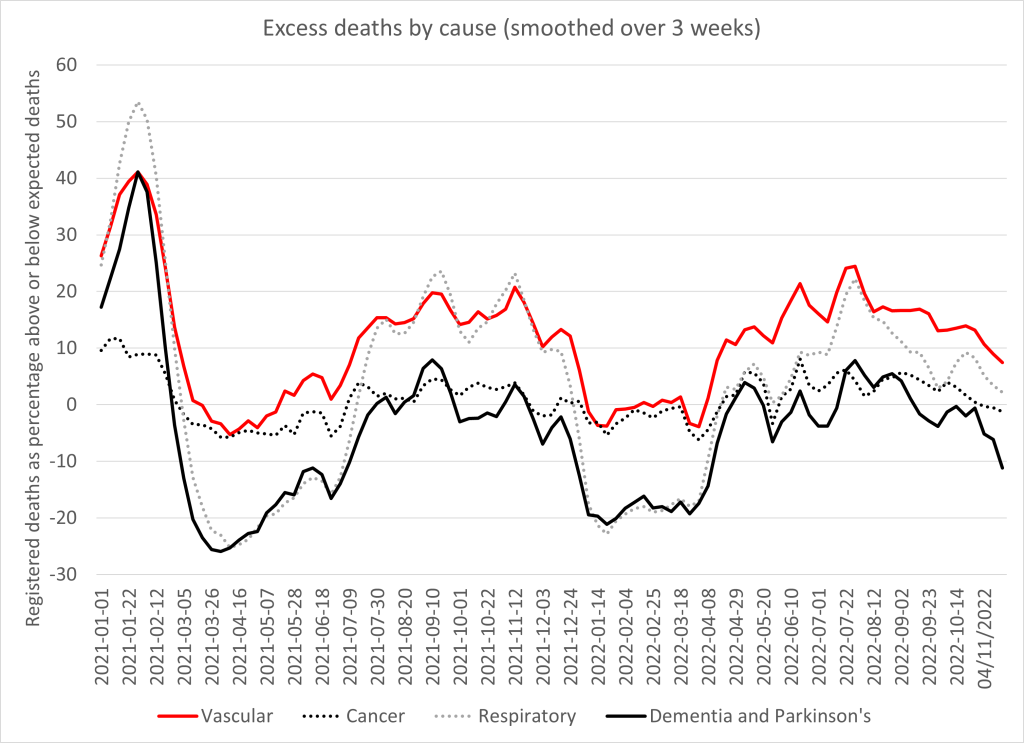
Plotting the death curves (figure 1) is revealing.
- All cause deaths were in excess at the beginning of 2021 but cancer (black dotted line) had the lowest increase.
- In spring 2021, for deaths associated with old age (black line) and respiratory deaths (grey dotted line) there were fewer deaths than expected. This is likely to be because people died earlier than they otherwise would have in January 2021 rather than spring. The same was not true for vascular deaths (red line) suggesting either the January deaths were not in those who would have died in spring, or else that there were additional vascular deaths in spring 2021 that made up the shortfall.
- From July 2021, excess deaths rise from all causes (but only slightly for cancer).
- For all causes (except cancer – black dotted line) there is a clear dip in deaths in winter 2021/22. This is an effect of the seasonal variation in deaths. More deaths are expected in winter and relative to previous winters last winter did not have high mortality. Again we see that vascular deaths do not see a deficit as if there are additional deaths making up the shortfall.
- From spring 2022, vascular deaths are notably high with respiratory deaths seeing a summer spike too. Deaths from diseases of old age are around expected levels.
To make sense of them let’s look at non-covid deaths only.
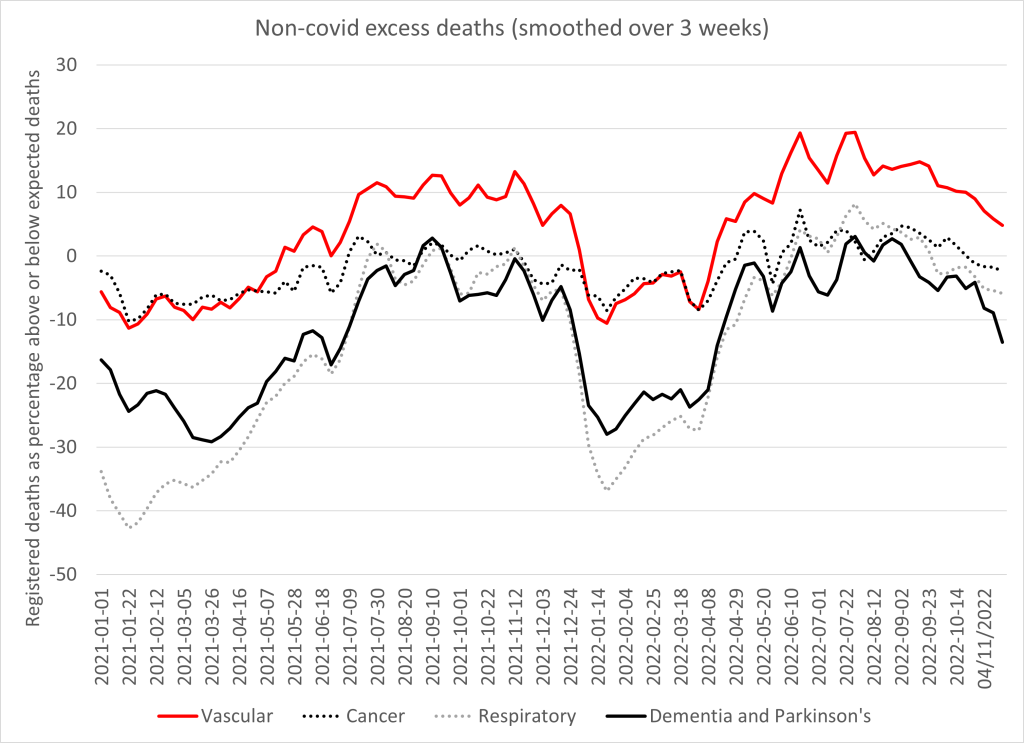
Figure 2 shows the same data but after the covid-labelled deaths have been subtracted. The only cause of death that remains significantly above expected levels are those with a vascular cause. Again the quiet winter meant that there were fewer deaths than an average winter in 2021/2 but that does not mean that there weren’t more deaths than there might have been. The rise in vascular deaths begins in early 2021. This is coincidental with the vaccination rollout, and whilst correlation does not equate to causation, this surely raises the possibility of a causal relationship.
There are several reasons why vaccination may be responsible for this rise:
- The original trial showed four cardiac arrest deaths in the treated arm and only one in the placebo arm after only around 6 months’ follow up.
- The evidence for vaccine induced myocarditis is well established and in older patients this may be mistaken for more common forms of heart disease.
- Studies in Thailand and Switzerland have shown rises in troponin levels consistent with damaged heart muscle in 3% of those vaccinated. Heart cells cannot be replaced and the scarring can lead to electrical conduction issues and sudden death.
- Vaccinated people had a rise in cardiovascular risk factors that would predict a significantly increased risk of heart disease (from 11% to 25% risk of a heart attack in 5 years).
- Dr Aseem Malhotra has reported on a separate team of cardiology researchers who had found the covid vaccine had caused inflammation around the coronary arteries but did not want to publish in case they lost funding from the pharmaceutical industry.
- HART has reported on the extra 20,000 cardiac arrest calls to ambulances in 2021 compared to 2019 (14,000 more than 2020).
- An Israeli paper showed a 25% increase in acute coronary syndrome and cardiac arrest calls in 16-39 year olds in Israel associated with the first and second doses of vaccine but not with covid infection.
- A study of 35 autopsies in Germany there were 5 deaths caused by vaccine with a further 20 deaths where a contribution from vaccination could not be excluded.
- Post mortem studies have shown inflammation of the coronary arteries after vaccination causing death four months later.
- A separate post mortem has shown vaccine derived spike protein in heart muscle in the absence of covid infection in a subject who had myocarditis before he died.
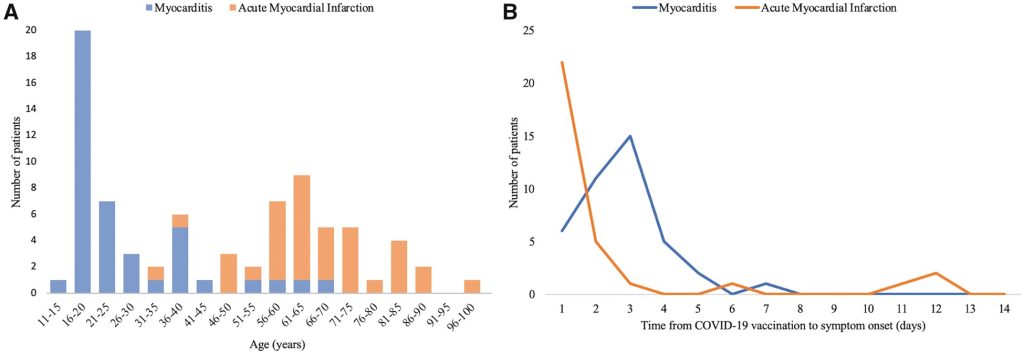
- The rate of myocardial infarction was disproportionately high in the first three days after vaccination (see figure 3).
- Australian hospitals have seen intense pressures since summer 2021 despite no significant covid or reduction in healthcare.
- Australians have seen a similarly timed rise in excess non-covid deaths, with ischaemic heart disease being the biggest contributor. This was despite no significant covid or reduction in healthcare as was seen in UK.
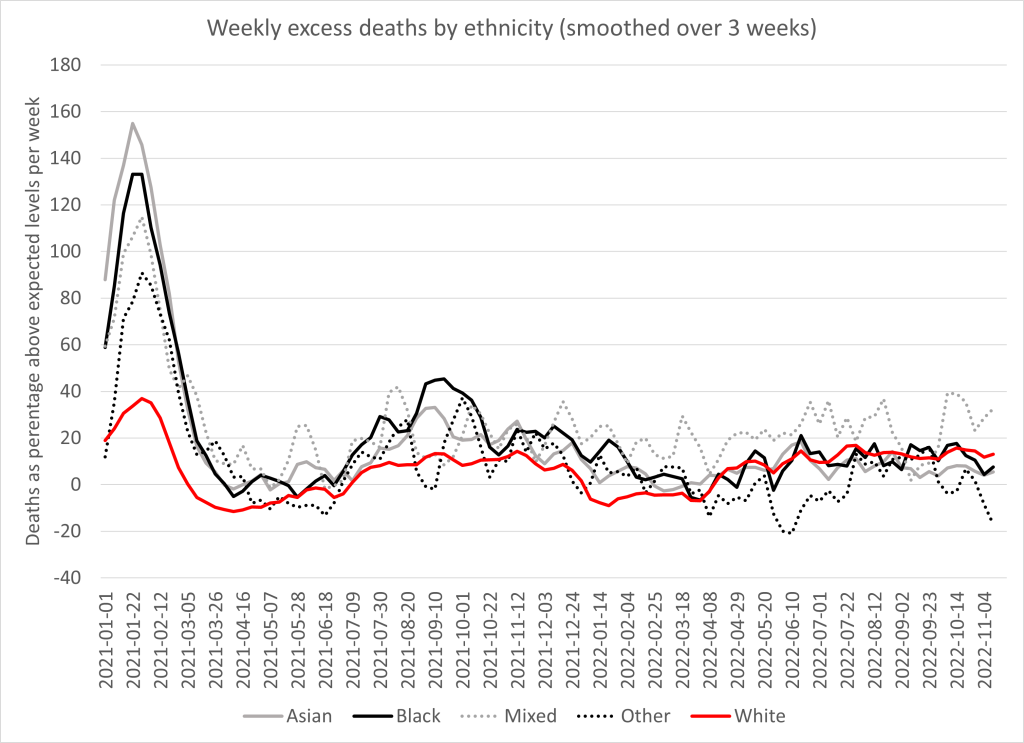
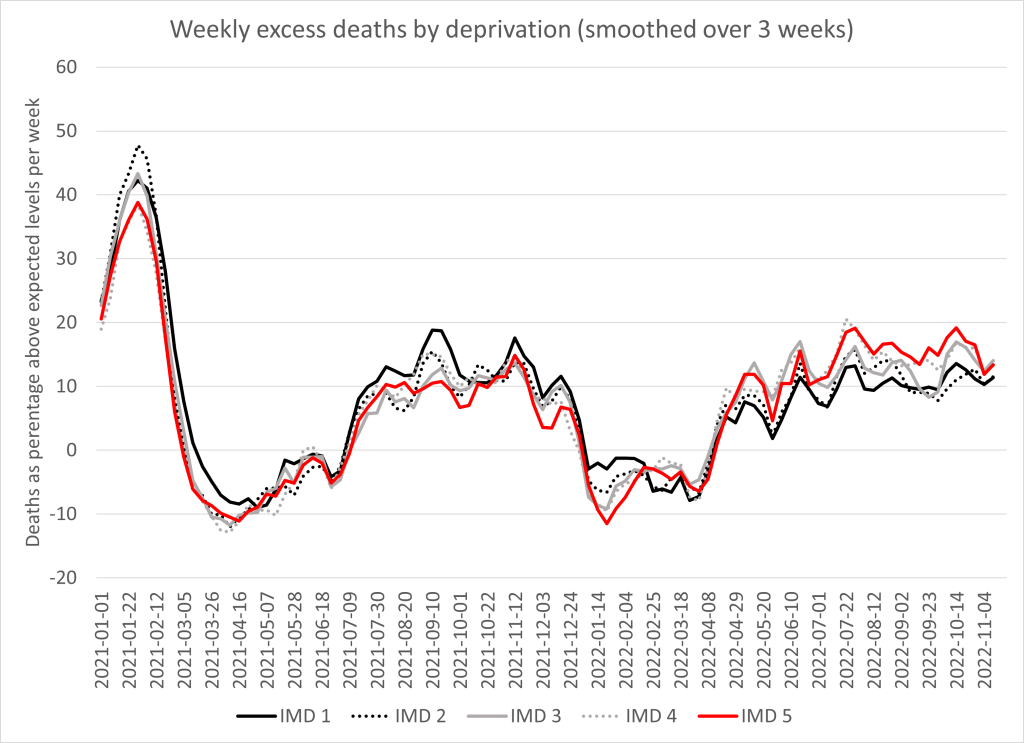
It is notable that the demographic of those dying has also changed. The same data shows that whereas covid disproportionately killed ethnic minorities, the recent excess has seen an equal increase in deaths in the white population (see figure 4). Covid also disproportionately killed those from more deprived demographics whereas recent deaths have been higher in the most well off (see figure 5). This shift could reflect the difference between those groups susceptible to covid deaths and those groups who are most heavily vaccinated.
It is noteworthy that as this evidence has accumulated, the primary argument that the vaccines are safe seems to be “we have injected billions of people with these vaccines”. While that may be true it does not falsify any of the concerns above. HART reiterates our call for the vaccines to be stopped pending an immediate, independent and thorough investigation into the cause of the rise in recent cardiovascular deaths.
